Every technology that later got called “general-purpose” looked, for its first decades, like a disappointment to the people trying to measure its economic effect. That is not a rhetorical flourish; it is the specific, repeated finding of the economic-history literature on steam, rail, and electrification, and it is the single most useful fact available for thinking about artificial intelligence and robotics between now and 2035. This article lays out what that literature actually shows, what remains disputed inside it, and then converts the pattern into three named forecasts — each with a horizon, an assumption set, an observable indicator, and a condition that would prove it wrong.
What a “general-purpose technology” is, and why the label matters
The term comes from a specific 1995 paper. Timothy Bresnahan and Manuel Trajtenberg proposed that a handful of technologies in history — they named the steam engine, the electric motor, and (in their own moment) semiconductors and computers — share three properties: pervasiveness across many downstream sectors, continued technical improvement over a long period, and “innovational complementarities,” meaning that as the core technology improves, it raises the returns to inventing things that use it [1]. That third property is the important one. A general-purpose technology (GPT) is not just widely used; it is widely re-invented around. Its economic effect is not one shock but a long cascade of complementary changes in organizations, skills, and other technologies that only make sense once the core technology exists.
That framing is analysis, not measurement — it is a theory economic historians use to organize evidence, and it is contested at the margins (which historical cases really qualify, how far “pervasive” has to reach). But it does generate a testable expectation: if AI is a genuine GPT, its productivity effects should show the same shape as steam and electricity did — a long, quiet implementation lag followed by a comparatively sudden acceleration once complementary reorganizations catch up — rather than showing up immediately as compute and model capability improve. That expectation is exactly what the next two sections test against the historical record.
Fact: the British industrial revolution grew more slowly than its name implies
The popular image of “the” Industrial Revolution is a sudden national acceleration starting around 1760. The economic-history literature has spent forty years dismantling that image with revised national-accounts estimates, and the direction of revision has been consistently downward. Nicholas Crafts’s reconstruction of British national output — built from industry-by-industry output series rather than the older, cruder aggregate estimates — found substantially slower growth in national income and industrial output through the late eighteenth century than the earlier Deane and Cole estimates had implied, with industrial output growth over 1700–1850 that had to be recalculated sector by sector, cotton textiles included, because the sectoral weights used in the older estimates had been overstating the industrializing sectors’ share of the whole economy [5]. Aggregate GDP growth for Britain across the classic “revolution” decades came out well below one percent a year for long stretches — a slow, grinding acceleration, not a takeoff. Crafts’s own later retrospective on this literature, revisiting it after four decades of subsequent data work, concludes that the basic downward revision has held up, even as the explanation for slow-but-real growth has kept shifting — from capital accumulation, to total-factor-productivity growth concentrated in a few sectors, to institutional change and the reallocation of labor out of low-productivity agriculture [6].
This is a fact about historical measurement, not a scenario: the growth-accounting literature that followed Crafts and Harley’s original re-estimation revised Britain’s classic industrial-revolution decades downward by on the order of a few tenths of a percentage point of annual GDP growth relative to older textbook figures, with industrial output growth over 1750–1850 landing near a third of one percent a year in some reconstructions — an order of magnitude slower than the phrase “revolution” suggests. The steam engine, the technology every textbook uses as the emblem of the period, took decades after Watt’s separate-condenser patent (1769) to become a majority source of British industrial power; waterwheels remained competitive well into the nineteenth century on cost grounds alone. The lesson for a GPT framework is specific: pervasiveness and complementary innovation are gradual, multi-decade processes even for the technology that gives its name to an entire historical epoch, and national statistics measure the lag, not the invention date.

Fact: electrification’s productivity payoff arrived roughly forty years after the technology
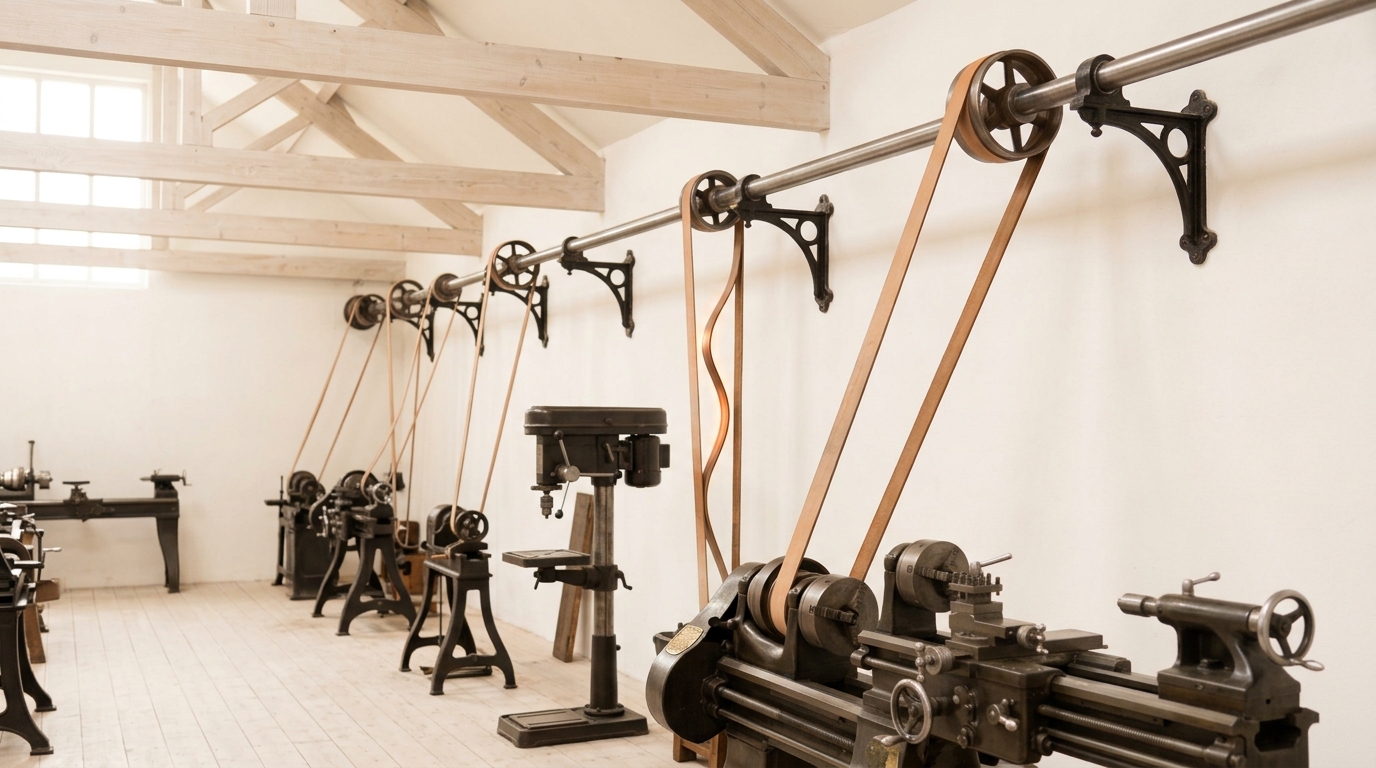
The clearest and most quantitatively specific version of the “delayed GPT payoff” pattern comes from Paul David’s 1990 paper on the diffusion of electric power in American factories. Central electricity generation and the practical incandescent lamp both date to around 1880. But as late as the turn of the century, only a small share of American factory mechanical drive had converted to electric motors, and adoption of electric lighting in homes was similarly limited at that point; broad diffusion — deployment past the halfway mark for both applications — did not arrive until the 1920s [2]. David’s specific historical claim, drawn from period industrial surveys, is that the delay was not primarily about motor cost or reliability. It was that factories initially bolted electric dynamos onto their existing architecture: one large central motor still turned one long overhead line shaft, with belts running down to every machine, exactly as steam power had. The productivity gain from electrification did not arrive until factory owners abandoned the line-shaft layout altogether and adopted “unit drive” — a small motor built into or attached to each individual machine — which required re-laying entire factory floors, changing the geometry of work, and retraining supervisors and workers around a physically different plant. That reorganization, David argued, is the genuinely limiting step, and it took about a generation.

Robert Solow’s famous 1987 observation supplies the modern half of the analogy: despite a large wave of business investment in computers through the 1970s and 1980s, measured productivity growth in the United States over that period was weak, prompting his remark that “you can see the computer age everywhere except in the productivity statistics” [10]. Economists who followed up on Solow’s observation — reviewing measurement problems, adoption lags, and the need for organizational change alongside the new technology — converged on an account structurally identical to David’s: IT-driven productivity growth in the United States did eventually arrive, concentrated in the 1990s, once organizations had reorganized business processes around computing rather than merely overlaying computers on unchanged workflows.
Brynjolfsson, Rock, and Syverson extended this same historical analogy directly to machine learning and artificial intelligence in a 2017 paper. They set out four candidate explanations for a possible AI productivity paradox — false expectations that overstate what the technology can do, mismeasurement of the actual output produced, redistribution of value between firms without net gain, and implementation lags — and concluded, based on the historical GPT diffusion pattern, that implementation lag was the most likely dominant factor: the most capable machine-learning systems of that moment had not yet diffused widely, and their productivity effects would not show up in aggregate statistics until a wave of complementary organizational innovations had been built around them [3]. This is an analytical claim about historical analogy, made before the recent generative-AI wave, not a settled empirical finding about AI’s effects in the 2020s — a distinction worth holding onto for the forecasting section below.

Analysis: what the diffusion-curve literature adds, and where vendor claims diverge from it
Separate from growth accounting is a body of work that measures technology adoption directly, rather than inferring it from aggregate output. Diego Comin and Bart Hobijn built a dataset — subsequently extended as the Cross-country Historical Adoption of Technology (CHAT) dataset — recording adoption of over a hundred technologies across roughly two hundred years and more than a hundred countries, including textile production, steel manufacture, communications, and electricity, and used it to test which country-level factors predict how fast a technology, once available anywhere, gets adopted elsewhere [7]. Their central empirical finding is a “trickle-down” pattern: new technologies are adopted first in whichever economies are already technologically advanced, and diffuse outward from there, with the speed of a given country’s adoption predicted mainly by its human-capital stock, type of government, openness to trade, and — importantly for a GPT argument — whether it had already adopted the predecessor technology the new one builds on. That last variable matters directly for AI and robotics: a country’s supply of engineers experienced with prior automation, its existing industrial digitization, and its existing broadband and compute infrastructure predict its position on the diffusion curve for AI-driven automation more than the sophistication of any specific new model does.
This is where careful reasoning has to separate documented historical pattern from a very different kind of claim: vendor and industry projections about AI’s near-term economic effect. Estimates of AI’s prospective contribution to global GDP circulated by AI vendors, consultancies, and industry associations are business forecasts, produced by parties with a direct commercial interest in the answer, built on assumption-heavy simulation rather than the kind of realized national-accounts data Crafts and Maddison-style projects assemble after the fact. They are not comparable in evidentiary weight to a peer-reviewed reconstruction of historical output, and this article does not treat them as data. What can be verified independently, from national accounts and firm-level productivity statistics, is the rate at which historically documented GPTs actually diffused — the record against which any near-term AI projection should be tested, rather than accepted on the strength of the forecaster’s confidence.
The long-run national-accounts backbone for that comparison — used throughout the growth-accounting literature cited above — is the Maddison Project Database, a collated set of historical GDP, GDP-per-capita, and productivity estimates now covering some 169 countries, in its 2023 update extending in some series back to antiquity and giving regional estimates from 1820 onward [8]. It is the standard reference point for arguing that any given decade’s growth was fast, slow, or ordinary by the standard of the last two centuries, and it underlies the claim above that classic industrial-revolution Britain grew slowly by modern standards, not quickly.
Fact: robotics is diffusing on a documented, measurable curve right now
Unlike GPT diffusion in the eighteenth or early twentieth century, industrial robot adoption is tracked in real time by an industry body with standing survey infrastructure. The International Federation of Robotics reported 542,000 new industrial robot installations worldwide in 2024, more than double the figure from ten years earlier, with annual installations exceeding 500,000 units for a fourth consecutive year and the global operational stock reaching about 4.66 million units, a nine percent increase over the prior year; Asia accounted for 74 percent of 2024’s new installations, compared with 16 percent in Europe and 9 percent in the Americas, and the IFR’s own outlook projects the market growing roughly 6 percent in 2025 and surpassing 700,000 annual installations by 2028 [9]. That is a documented fact about a current, ongoing diffusion curve, not a historical reconstruction — and it gives this article’s third scenario below a specific, checkable trajectory to test predictions against.
The labor-market consequence of robot adoption is separately documented in Daron Acemoglu and Pascual Restrepo’s study of US commuting zones, which found that each additional robot per thousand workers was associated with a roughly 0.2 percentage point reduction in the employment-to-population ratio and about a 0.42 percent reduction in wages in the affected local labor market, with the arrival of one new industrial robot associated with an estimated loss of about 5.6 jobs locally; the paper found no differential pre-1990 trend in the areas later most exposed to robots, and argued the effect was distinguishable from other capital investment [4]. This is a peer-reviewed, identified estimate for a specific place and period (predominantly manufacturing-heavy US commuting zones, 1990–2007), not a universal constant — it should not be extrapolated to other countries, sectors, or robot generations without restating those scope conditions, and the paper itself does not claim it should be.

Three falsifiable 2035 scenarios
The historical record above supports three genuinely distinct empirical questions about the decade ahead. Each scenario below states a horizon, the assumptions it depends on, what would count as observing it, and — critically — what finding would disconfirm it. None of these are predictions of certainty; they are structured bets, stated so that 2035 can adjudicate them.
Scenario 1 — AI shows a measurable, attributable GPT-shaped productivity effect in national statistics by 2035. Horizon: national statistical agencies’ multifactor-productivity releases for 2033–2035, compared against 2015–2023 trend. Assumptions: that AI’s productivity effect, if real, follows the electrification/computerization pattern of a lagged S-curve rather than an immediate step change, and that statistical agencies retain broadly comparable productivity-accounting methodology over the period. Observable indicator: an acceleration in multifactor (total factor) productivity growth in major advanced economies, over a multi-year rather than single-year window, that growth-accounting studies can plausibly attribute in substantial part to AI-complementary capital and organizational investment — the same kind of attribution Paul David and the computer-productivity literature made retrospectively for electrification and IT [2] [3]. Disconfirmation: if multifactor productivity growth in 2033–2035 remains at or below the weak 2010–2023 trend across major advanced economies despite continued heavy AI capital investment, this scenario is false — the Solow-paradox pattern will have persisted past the point the historical electrification and computer analogies would predict resolution, which would itself be an important, reportable finding rather than an absence of one.
Scenario 2 — AI-assisted digitization and re-analysis materially revise existing economic-history estimates by 2035. Horizon: published economic-history literature (peer-reviewed journals, working papers from bodies like NBER) through 2035. Assumptions: that the volume of unprocessed archival economic records (ledgers, patent registers, customs and tax records) remains large enough that automated transcription and record-linkage meaningfully expand the accessible dataset, following the trajectory already visible in projects like the CHAT technology-adoption dataset [7] and the continually revised Maddison Project [8]. Observable indicator: at least one widely cited, peer-reviewed revision to a major pre-1950 national-accounts or industrial-output series (in the tradition of the Crafts–Harley restatement of British industrial revolution growth [5]) that explicitly credits large-scale automated digitization, OCR, or AI-assisted record linkage as a necessary enabling method rather than merely faster clerical transcription. Disconfirmation: if by 2035 the major revisions to historical growth series continue to come from the same manual, single-archive methods used by Crafts and Harley in the 1980s, with automated methods used only for incremental data entry rather than enabling any substantive reinterpretation, this scenario is false.
Scenario 3 — robotics diffusion through 2035 follows the same shape (though not necessarily the same speed) as the documented historical GPT-adoption curve. Horizon: IFR World Robotics annual reports, 2026–2035 editions, compared against the 2015–2025 installation series already published [9]. Assumptions: that “the historical GPT-adoption curve” means the Comin–Hobijn empirical pattern of concentrated early adoption in already-advanced economies followed by a slower trickle-down, mediated by human capital, openness, and prior automation exposure [7] — not a claim about a fixed universal timeline. Observable indicator: continued concentration of new installations in a small number of already-advanced manufacturing economies (as the 74 percent Asia share and 54 percent China share of 2024 installations already show), with lagging countries’ adoption rates over 2026–2035 predicted better by their existing automation and engineering base than by the marginal capability of the robots on offer — mirroring the labor-market geography documented for the 1990–2007 period by Acemoglu and Restrepo [4]. Disconfirmation: if instead installations broaden rapidly and roughly uniformly across countries regardless of prior industrial-automation base — for instance if lower-middle-income countries with little existing robot stock show adoption rates converging toward those of Japan, Korea, Germany, and China within the decade — that would contradict the trickle-down pattern Comin and Hobijn documented for two centuries of prior technologies, and would itself be a genuinely novel finding: evidence that AI-enabled robotics diffuses on a different, flatter curve than every earlier general-purpose technology in the historical record.
What the pattern is not evidence for
None of the above licenses the inference that AI’s ultimate economic effect will necessarily match steam, electricity, or computing in scale — GPT theory identifies a recurring shape (pervasiveness, continued improvement, complementary reorganization, a measurement lag), not a guaranteed magnitude, and Bresnahan and Trajtenberg’s own framework treats “which technologies qualify as GPTs” as an open, historically contingent question rather than a checklist any sufficiently capable system automatically satisfies [1]. Nor does the historical productivity-paradox literature support the inference that any multi-year gap between technology investment and measured productivity growth confirms an eventual payoff is coming — David’s and Solow’s cases resolved into later measured gains, but a lag is consistent with either an eventual payoff or a technology that simply never clears the reorganization threshold at scale, and economic history contains failed as well as successful general-purpose technologies. The honest position, coming out of this literature, is that a measurement lag is uninformative on its own; only the disconfirmation conditions stated above — a specific multi-year statistical window, a specific documented revision, a specific diffusion-geography pattern — convert “wait and see” into something that can actually be checked against evidence in 2035.
Where expert judgment genuinely diverges
Economic historians and economists working on this question do not agree on several load-bearing points, and that disagreement should be represented as disagreement rather than resolved by picking a side. Crafts’s own retrospective survey documents an unsettled debate over why British industrial growth was slow-but-real — competing accounts emphasize capital accumulation, sector-specific total-factor-productivity growth, or labor reallocation out of agriculture, and the literature has not converged on a single dominant mechanism even four decades after the original downward revision [6]. Separately, whether the 2017 Brynjolfsson–Rock–Syverson implementation-lag account of an “AI productivity paradox” straightforwardly applies to the 2020s generative-AI wave, as opposed to the narrower machine-learning applications the paper had in view when written, is a live and unresolved question in the applied-economics literature rather than a settled extension — later data will bear on it, which is exactly why Scenario 1 above is framed as a forecast rather than restated as an established fact.
Conclusion
The historical record does not say whether AI will be electricity or will be a technology that never clears the reorganization threshold. It says something narrower and more useful: every technology that did clear that threshold took longer than contemporaries expected, showed weak or invisible aggregate productivity effects for a long stretch beforehand, and required organizational reconstruction — not just deployment — before the statistics moved. Robotics diffusion is already trackable in real time and already shows the concentrated, human-capital-dependent geography the diffusion literature would predict. Whether AI joins that reference class by 2035, whether the tools built from AI methods substantially revise how economic historians read the record of the last general-purpose technologies, and whether robotics keeps following the trickle-down curve or breaks from it, are three separate, checkable questions — not one verdict to be guessed now.