The whitepaper ends at installation day
Almost everything published about AI datacenter interconnects describes a design: a topology chosen, a bandwidth ratio justified, a congestion-control scheme evaluated against a testbed. Almost nothing published describes what happens the following Tuesday, when a training job stalls at step 4,812, a scheduler has to decide which rack to draw the next allocation from, and the on-call engineer has forty minutes before the run’s cost clock makes the decision for them.
Operating a fabric is a distinct discipline from designing one, with its own literature, its own instruments and its own failure modes. This guide works through six of its parts in the order an operator actually meets them: placing a job against a topology that already exists, tuning the collective-communication parameters that decide whether the placement pays off, diagnosing congestion and tail latency once a run is live, choosing between RoCE and InfiniBand for a specific cluster rather than in the abstract, cabling and integrating hardware so it stays serviceable, and the failure patterns that interrupt distributed training at scale. Throughout, a vendor’s documentation is cited as a vendor’s documentation, an operator’s disclosure as one operator’s experience on one cluster, and a peer-reviewed result as exactly what its authors measured — not generalised beyond what the source supports.
Placing jobs where the topology rewards them
A scheduler that ignores topology treats every pair of GPUs as equidistant. No fabric built at scale is actually built that way, and the gap between the idealised assumption and the physical layout is where a large fraction of avoidable slowdown lives.
The mechanism is direct. Meta’s account of its RoCE backend describes a two-tier “AI Zone”: rack-level training switches (RTSW) connecting GPUs by short copper cable within a rack, cluster-level training switches (CTSW) providing full-bisection connectivity across racks within a zone, and an aggregator tier (ATSW) added on top that is, in the company’s own words, “oversubscribed by design” when zones are joined together [8]. A job whose communicating ranks stay inside one zone crosses only the well-provisioned tiers. A job whose ranks are scattered across zones by an oblivious scheduler pays the aggregator tier’s oversubscription on every collective, whether or not the job’s own traffic pattern needed to cross it. Meta’s response was to make the job scheduler topology-aware specifically to keep heavy, frequent collectives inside a zone [8].
Academic work has pushed this further, treating topology and parallelization strategy as one joint decision rather than two sequential ones. TopoOpt, presented at NSDI 2023, builds a direct-connect fabric that co-optimises network topology, computation and communication for a specific training job rather than assuming a fixed, general-purpose topology underneath it, using the fact that all-reduce traffic can be rearranged to fit whatever topology is chosen; the authors report up to a 3.4x reduction in training time against a similarly costed fat-tree in large-scale simulation, evaluated on a 12-node RDMA prototype at 100 Gb/s [15]. That is a research result under the authors’ own experimental conditions, not a deployed production figure, and it should be read as evidence that topology-aware placement has a large ceiling rather than as a number that transfers directly to another cluster’s fat-tree.
For a practitioner without a custom fabric to build, the operational form of this lesson is narrower and more mundane: know which rank ranges share a rack, which share a zone, and which cross an oversubscribed tier, and constrain the parallelism plan so that the most latency-sensitive collective — typically tensor-parallel all-reduces sitting in the critical path of every layer — never has to cross the worst tier. ByteDance’s MegaScale system describes exactly this kind of full-stack co-design across model architecture, computation-communication overlap and networking as necessary to sustain 55.2% model FLOPs utilisation training a 175-billion-parameter model on 12,288 GPUs, a figure the authors report as a 1.34x improvement over a Megatron-LM baseline under their own measurement [11]. Placement is not a scheduling nicety bolted onto training; in their account it is one of several co-equal levers that determined whether the cluster’s rated throughput was actually realised.
The knobs that actually move collective performance
NCCL exposes more than a hundred environment variables, and the practitioner’s first mistake is usually treating all of them as equally worth tuning. A smaller set does most of the work, and NVIDIA’s own user guide is explicit that several of the debugging-only variables “should not be used in production” at all [1].
NCCL_ALGO and NCCL_PROTO select which collective algorithm and wire protocol a given operation uses; NCCL_IB_HCA filters which InfiniBand host channel adapters, ports and rails are eligible for a job, in a format that can descend to individual rail and plane; NCCL_SOCKET_IFNAME performs the equivalent filtering for the out-of-band control interfaces [1]. On the InfiniBand transport specifically, NCCL_IB_TIMEOUT sets the retransmission timeout as NCCL_IB_RETRY_CNT defaults to seven retry attempts before a queue pair gives up [1] — both are tuned upward on fabrics with longer queueing or higher loss, and tuned down when a practitioner wants failures to surface quickly rather than be masked by retries. NCCL_NET_GDR_LEVEL governs how aggressively GPUDirect RDMA is used for a given GPU-to-NIC distance, expressed as PCIe topology levels from same-device (LOC) out to crossing a NUMA boundary (SYS) [1], and it interacts directly with GPUDirect RDMA’s own hard requirement that the GPU and the network adapter share a PCIe root complex for the peer-to-peer path to work at all [3]. A GDR level set too permissively on a server whose GPU and NIC sit behind different root complexes does not fail loudly; it silently falls back to a slower path, and the first symptom an operator sees is a bandwidth number that looks wrong without an accompanying error.
That last point is the operational discipline this section is really about: a changed environment variable is a hypothesis, not a result, until it is measured against the fabric it was set on. The standard instrument for that measurement is bus bandwidth as reported by NCCL’s own test suite, which applies an operation-specific correction factor to the raw bytes-per-second figure —
Reading a congested fabric from the outside
By the time a training job’s step time is visibly elevated, the cause is rarely a single obvious fault. It is more often a link running within its pass/fail specification but below the margin the workload needs, and finding it requires working from more than one signal at once.
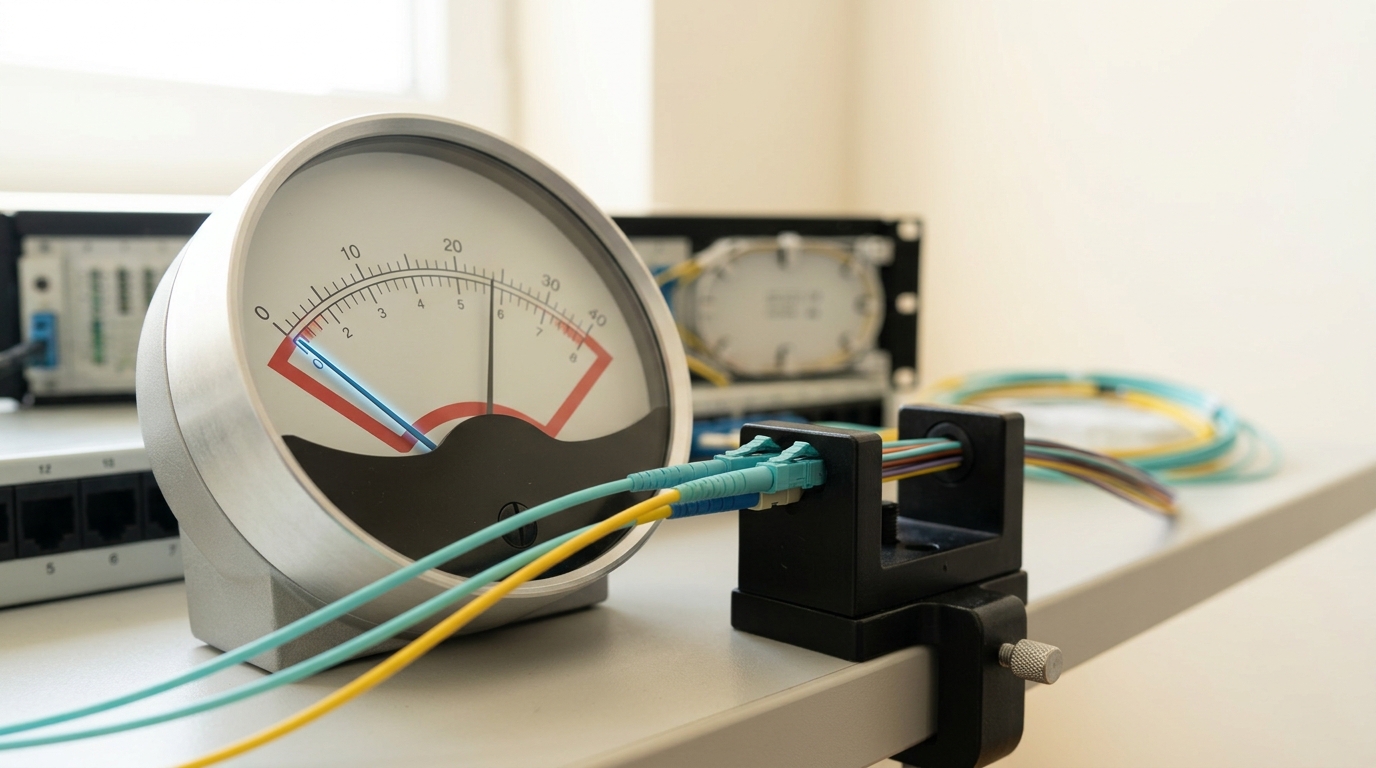
The physical layer is the first place to look, and it has its own, older diagnostic model. Optical received power at a detector is approximately
where
Above the physical layer, congestion is a transport and queueing problem, and it behaves differently from ordinary datacenter traffic because AI training traffic is not ordinary datacenter traffic. Alibaba’s account of its HPN fabric and Meta’s account of its RoCE backend converge on the same diagnosis: training traffic consists of a small number of very large, bursty, periodic flows rather than many small independent ones, which defeats equal-cost multipath routing’s usual assumption that hash collisions average out across a large population of flows [8]. Meta reports that its 400G deployments saw degraded performance under default DCQCN settings and moved to relying on priority flow control alone for over a year, paired with a receiver-driven admission scheme in which the collective library coordinates with the RoCE transport so receivers signal senders when to admit more in-flight traffic [8]. That is one operator’s account of one fabric generation, not a general verdict on DCQCN; the congestion-control scheme itself, introduced by Zhu and colleagues, combines explicit congestion notification with priority flow control specifically because PFC alone causes head-of-line blocking and unfairness when used without a companion signal [13], and Guo and colleagues’ account of RoCEv2 at Microsoft scale documents a related but distinct set of hazards — PFC-induced deadlock, RDMA transport livelock, and NIC pause-frame storms — that had to be engineered around with a DSCP-based priority scheme before RDMA could be trusted broadly in their datacenters [14].
A different, complementary diagnostic tradition treats delay itself as the primary congestion signal rather than loss or an explicit marking. Google’s Swift, presented at SIGCOMM 2020, uses hardware timestamps already present in modern NICs to hold end-to-end delay near a target, and its authors report the design’s operational virtue as much as its performance: delay decomposes cleanly into a fabric component and a host component, which the authors state makes the signal easier to reason about in production than a scheme whose congestion evidence is entangled across layers, alongside reported tail latencies under fifty microseconds for short RPCs at close to full per-server throughput in their large-scale testbed [10]. For a practitioner without access to that instrumentation, the transferable lesson is the framing rather than the algorithm: when a step-time regression cannot be attributed to a specific down link, decomposing the delay budget by hop is more diagnostic than watching aggregate throughput, because aggregate throughput can look nearly normal while one hop’s queueing accounts for all of the added tail. MegaScale’s authors make the same point from the systems-engineering side, describing purpose-built diagnosis tooling that monitors deep into the stack specifically because, in their words, hard stability issues at this scale only emerge with in-depth observability and are not visible from top-level job metrics alone [11].
RoCE or InfiniBand: the decision practitioners actually face
The comparison is usually presented as a performance question. In practice it is at least as much an operations question, and the two fabrics ask different things of the team that has to keep them healthy.
InfiniBand ships as a more fully closed, purpose-built stack. NVIDIA’s Quantum-2 platform — the seventh generation of the company’s InfiniBand architecture — is marketed with adaptive routing, in-network computing through its SHARPv3 aggregation engine, and what NVIDIA describes as self-healing networking, alongside 64 ports of 400 Gb/s NDR bandwidth per switch [5]; these are vendor claims about a specific, tightly integrated product line, not independent measurements, and they should be read as describing what the platform is designed to do rather than what every deployment achieves. RoCE takes the opposite structural approach: RDMA semantics carried over the same Ethernet switches, transceivers and cabling ecosystem an organisation may already operate for everything else, standardised as RoCEv2 by the InfiniBand Trade Association to route over Layer 3 rather than being confined to a single Ethernet broadcast domain [6].
That portability is also where RoCE’s operational cost concentrates. Because RoCE borrows a general-purpose Ethernet fabric rather than a purpose-built one, it inherits Ethernet’s congestion-control assumptions and has to be actively corrected against them — which is exactly the history that produced DCQCN [13], the DSCP-based scaling work needed to run RoCEv2 safely beyond a single VLAN [14], and Meta’s later departure from default DCQCN settings once 400G forced the tuning to be redone [8]. None of that work is optional; it is the price of the flexibility, and a team adopting RoCE without the operational capacity to own PFC and ECN tuning is choosing a fabric it is not yet staffed to run. InfiniBand’s narrower vendor surface trades that tuning burden for less flexibility in switch and optics sourcing, and for dependency on a single architecture’s roadmap.
A third path is now standardised rather than merely proposed. The Ultra Ethernet Consortium released Specification 1.0 on 11 June 2025, covering transport, congestion control, direct memory access, Ethernet link and physical layers, and security, with a stated goal of end-to-end scalability to millions of endpoints [7]. That is a specification claim from the standards body that wrote it, not yet a track record from deployed silicon at the scale AI training clusters now reach, and the honest practitioner position is to treat it as an emerging option to evaluate on its own merits as compliant hardware ships, rather than as a settled answer to the RoCE-versus-InfiniBand question today. Where public experts disagree — and they do, between operators who have found RoCE’s tuning burden manageable at their scale and vendors and integrators who argue a purpose-built fabric removes risk a general-purpose one cannot — the disagreement tracks each side’s own operational history more than it tracks a controlled comparison, because no public benchmark holds cluster scale, workload mix and operations-team maturity constant across both fabrics at once.
Cabling and rack integration that survives contact with the floor
A fabric is judged on installation day by whether the row looks finished. It is judged for the following three years by whether a single transceiver can be swapped without touching six other links, and those two judgments favour different practices.
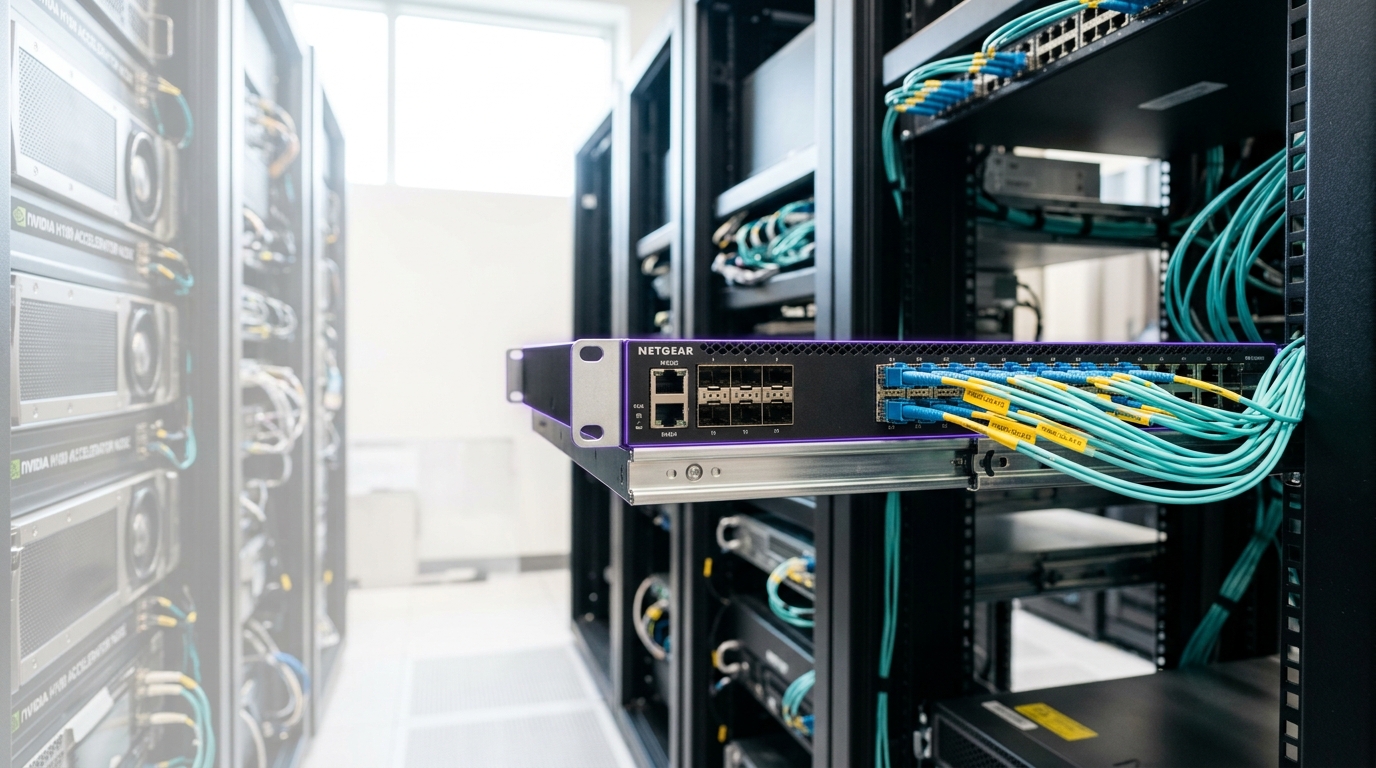
NVIDIA’s DGX SuperPOD cabling design guide treats this as a planning problem before it is a labour problem: it works through an InfiniBand cables primer covering mixed widths and rates, connector types, breakout cables and cable-latency considerations, a parallel Ethernet cables primer, cable deployment planning that produces a connectivity bill of materials and a labelling scheme before installation begins, and a cable support system section covering mounting, load distribution and single- versus dual-layer trapeze systems for carrying bundled runs across a row [4]. The throughline across all of it is that a cable run is documented and supported as an asset with an expected multi-year service life, not laid in place and then forgotten.
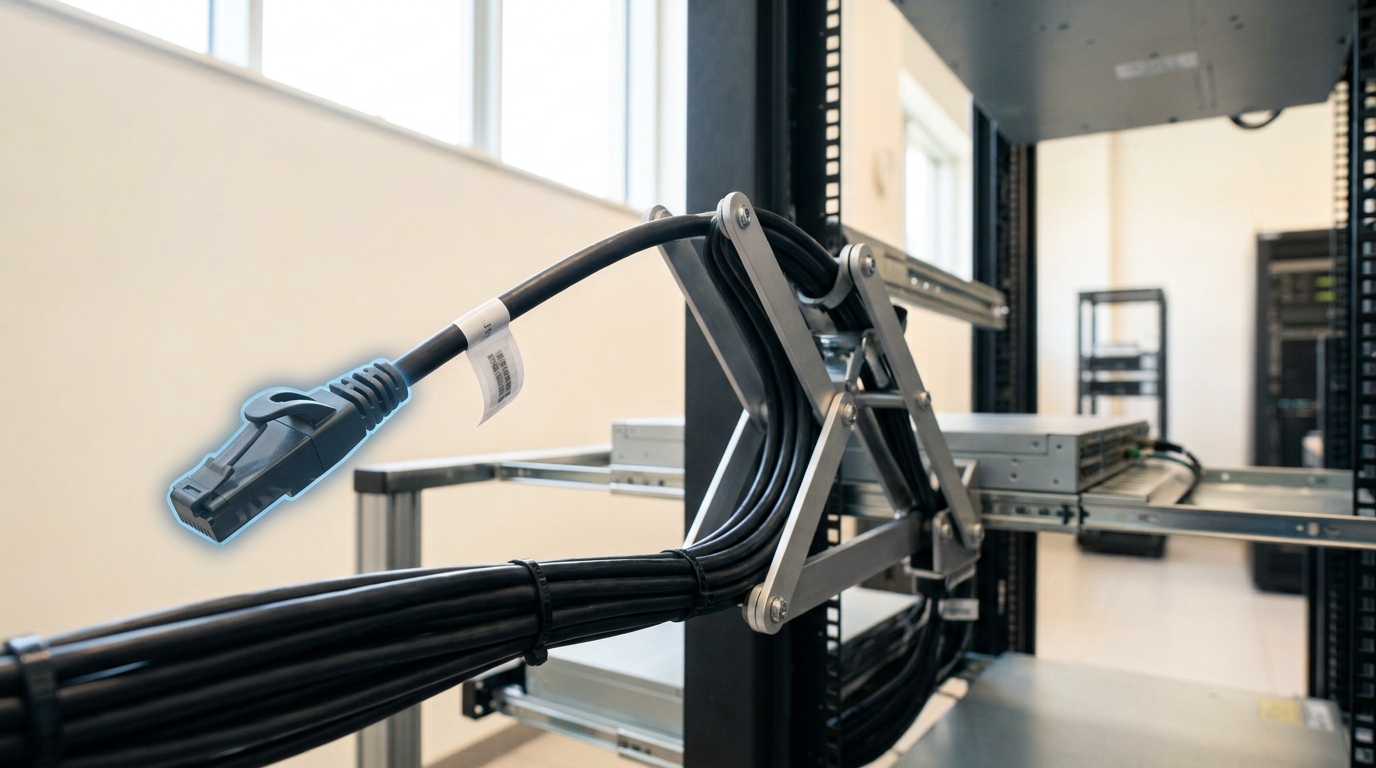
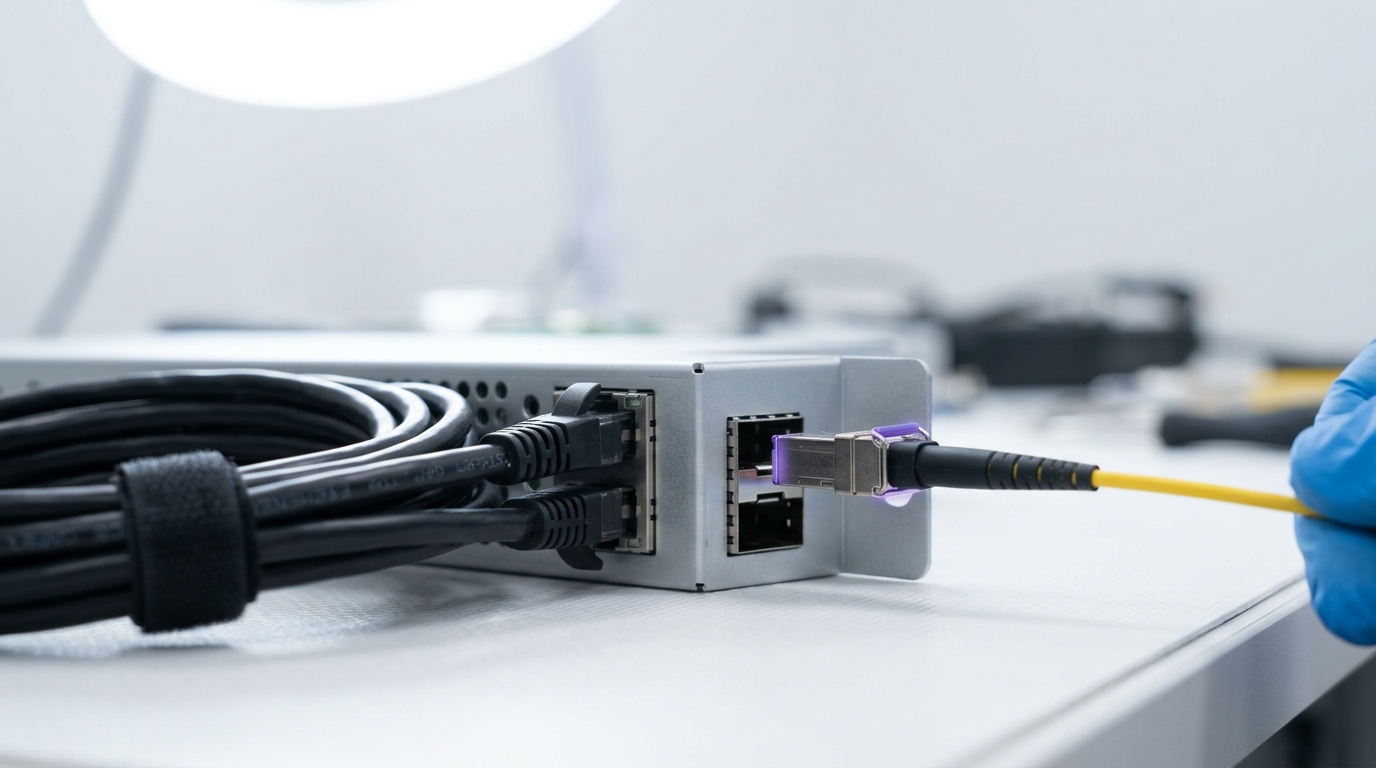
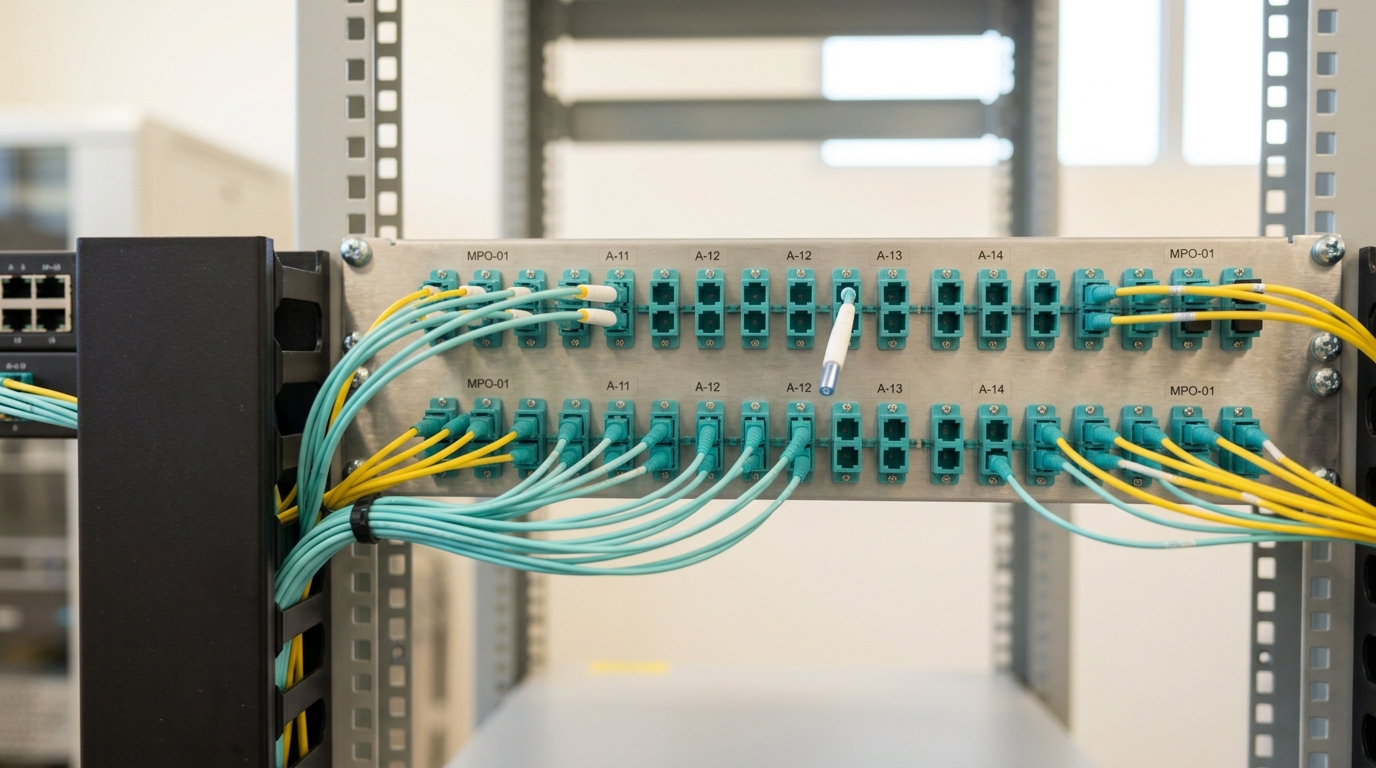
Two practices carry disproportionate weight in the guide and in operator accounts more broadly. First, bend radius and strain relief are treated as reliability properties, not cosmetic ones: a cable dressed too tightly around a rack corner degrades gradually rather than failing outright, which means the damage shows up later as the marginal-link problem described above rather than as an installation-day defect anyone would catch. Second, labelling and a maintained bill of materials are treated as part of the fabric’s own reliability engineering, because the real cost of an undocumented run is not the time to trace it once — it is the time to trace it during an incident, under a running training job whose cost clock does not pause while a technician reads port numbers off a spreadsheet that does not match the rack. A cable-management arm exists to make that later intervention possible without disturbing neighbouring links, which is precisely why it belongs in the installation procedure rather than being treated as an optional finishing touch.
Where distributed training runs actually go wrong at scale
The clearest public accounting of failure at this scale comes from Meta’s study of two large multi-tenant ML research clusters, drawing on eleven months of data covering four million jobs and more than 150 million A100 GPU-hours [9]. The authors built a taxonomy of failure causes, fitted a model projecting mean time to failure as a function of cluster scale, and introduced an “Effective Training Time Ratio” to quantify how much of a job’s wall-clock time survives interruption and recovery rather than being lost to it [9]. Their headline finding is not that large jobs fail more often in absolute terms — smaller jobs dominate the cluster’s job count — but that large jobs are disproportionately vulnerable per unit of useful compute delivered, which means the interconnect’s contribution to reliability compounds exactly where it matters most: the runs an organisation can least afford to restart from scratch [9].
Meta’s Llama 3 disclosure, referenced widely in the interconnect literature and consistent with this pattern, describes hardware issues, and GPU-related problems specifically, as the largest category of unexpected training interruptions in their pretraining runs; a large fraction of the network’s contribution to that total does not present as “the network is down” but as a degraded link that keeps a collective limping rather than failing outright, which is harder to detect and harder to page a human about than an outright failure. MegaScale’s authors describe building dedicated tooling for exactly this reason, because in their account the failures that actually cost wall-clock time at scale are the ones invisible to ordinary job-level monitoring and only surface through instrumentation built specifically to look for them [11].
A short, recurring list of concrete pitfalls follows from these accounts and from the sections above: firmware and driver versions drifting out of sync across a fleet, so that a fix validated on one batch of switches or NICs is silently absent on another; NCCL environment-variable changes validated at small scale and never re-measured at production rank count; a scheduler that is topology-blind by default and only becomes topology-aware after the first cross-zone congestion incident makes the cost visible; cable runs installed without a maintained bill of materials, so that a marginal link found during an incident cannot be traced to its physical location without disturbing working neighbours; and treating RoCE’s congestion-control tuning as a one-time setup task rather than a parameter that has to be revisited at every link-speed generation, exactly as Meta’s account of moving from 200G to 400G describes [8].
A short checklist for the people who carry the pager
Map the topology before the first job runs, not after the first incident. Know which rank ranges share a rack, a zone and an oversubscribed tier, and constrain the parallelism plan so the most latency-sensitive collective never has to cross the worst one.
Measure every tuning change at production rank count. A bus-bandwidth figure from a two-node test is a hint, not a result; the correction factors that make bus bandwidth comparable across rank counts exist for exactly this reason [2].
Treat “link up” as a pass, not a clean bill of health. A connector or a cable can sit within specification and still be the reason a collective’s tail is long; check margin, not just status.
Revisit congestion-control tuning at every link-speed generation. Settings validated at one speed are not guaranteed to hold at the next, and assuming they do is how a known-good fabric becomes an intermittently congested one.
Document cable runs as reliability infrastructure, not paperwork. The cost of an undocumented run is paid during the incident that needs it traced, under a job whose cost clock is still running.
Predictions, with the observations that would falsify them
These are forecasts, kept separate from the sourced practice above. Horizon: 15 August 2029. The assumptions behind all four are that accelerator counts per training run continue to grow and that no single interconnect technology achieves outright substitution for the others in that window.
One. Topology-aware scheduling will become a default feature of mainstream cluster schedulers rather than a custom capability built in-house, as it is described in Meta’s and ByteDance’s current accounts [8, 11]. Observable indicator: topology-aware placement shipping as a documented, non-custom feature in widely used open-source schedulers. Disconfirmed if large operators in 2029 still describe topology-aware placement as bespoke internal tooling built outside their scheduler of record.
Two. Physical-layer margin monitoring — continuous optical power and error-rate tracking rather than periodic spot checks — will become a standard, always-on part of fabric operations rather than an incident-response tool. Disconfirmed if published operator postmortems in 2029 continue to describe marginal-link discovery as a reactive, incident-triggered process rather than a continuously monitored one.
Three. Ultra Ethernet-compliant hardware will accumulate a public operational track record comparable in depth to what RoCEv2 and InfiniBand have today, including documented congestion-control tuning experience at multiple link-speed generations. Disconfirmed if, by the horizon, UEC deployments remain limited to vendor demonstrations and early-access pilots with no comparable public operator disclosure.
Four. Published large-run postmortems will increasingly attribute lost throughput to degraded, still-functioning links rather than to outright failures, as instrumentation for finding the former improves. Disconfirmed if the leading reported cause of lost throughput in 2029 retrospectives remains hard failures rather than degraded-margin links.
None of these requires a new algorithm or a new topology. They follow from what is already visible in the operator disclosures above: placement, tuning and physical-layer margin are managed today by teams that built their own tooling for it, and the gap between that bespoke practice and a standard one is closing rather than widening.
What to take away
An AI interconnect fabric is not finished when it is designed, or even when it is installed; it is finished, provisionally and repeatedly, every time an operator places a job against its real topology, measures a tuning change at the scale that matters, finds a link running under margin before it becomes an outage, and dresses a cable so the next intervention does not have to undo it. Every one of those is a practice with a name, an instrument and — increasingly — a public disclosure behind it. The gap this guide has tried to close is that the disclosures exist scattered across vendor documentation, standards releases and systems papers, while the job of running a fabric requires all of them at once, on the same rack, on the same night.