A plant that happens to compute
The conventional description of a datacenter runs from the inside out: chips, then servers, then racks, then a room, then a building wrapped around them. That order is backwards, and it produces the characteristic confusions of the current infrastructure debate — the belief that capacity is a procurement problem, that efficiency is a chip property, and that a facility can be sited wherever land is cheap.
Reverse the order. An AI datacenter is a power and heat plant with a computing load attached. Electricity arrives at a fence, is transformed and conditioned and distributed, is converted almost entirely into heat, and that heat is then moved out of the building and rejected to the environment. The accelerators sit in the middle of this flow as the thing that makes the conversion useful, but they are not what limits it. The limits are at the two ends: how much power can be delivered, and how much heat can be carried away.
This is why the useful comparison is not to an office building with servers in it but to a hydroelectric powerhouse. A powerhouse is an enormous fixed capital object whose output is bounded by head and by tailwater, not by the generators. Add a fourth machine to a three-machine hall and you have added nothing unless the penstock and the tailrace can support it.
The electrical supply chain, from the fence inward
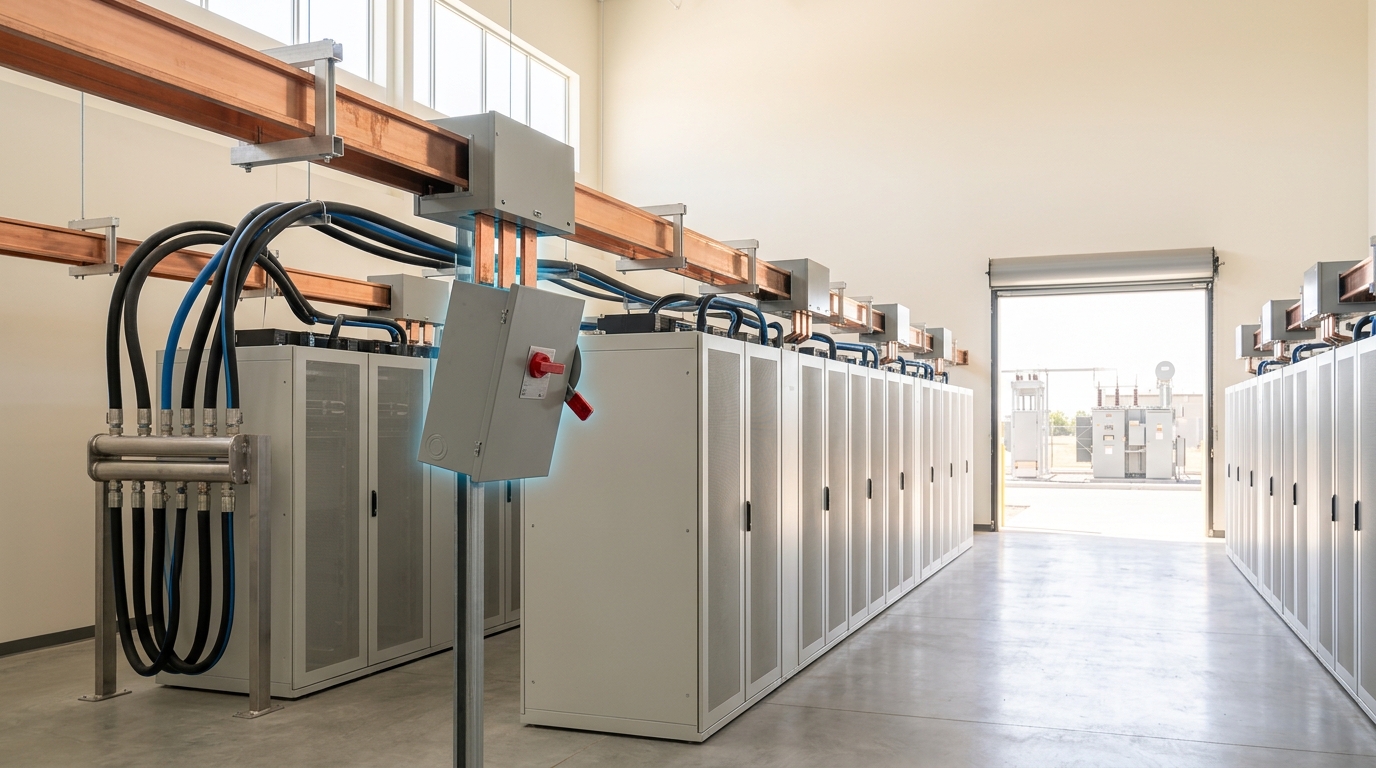
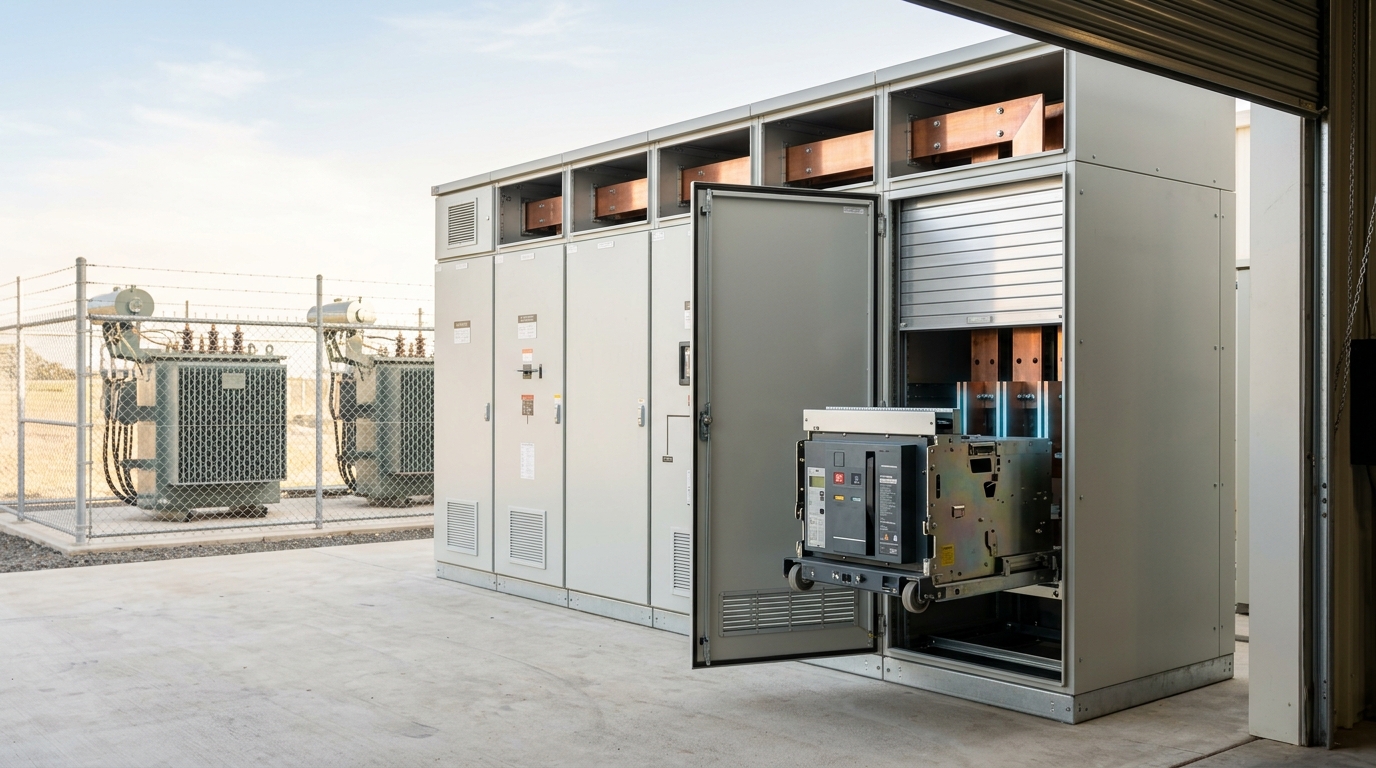
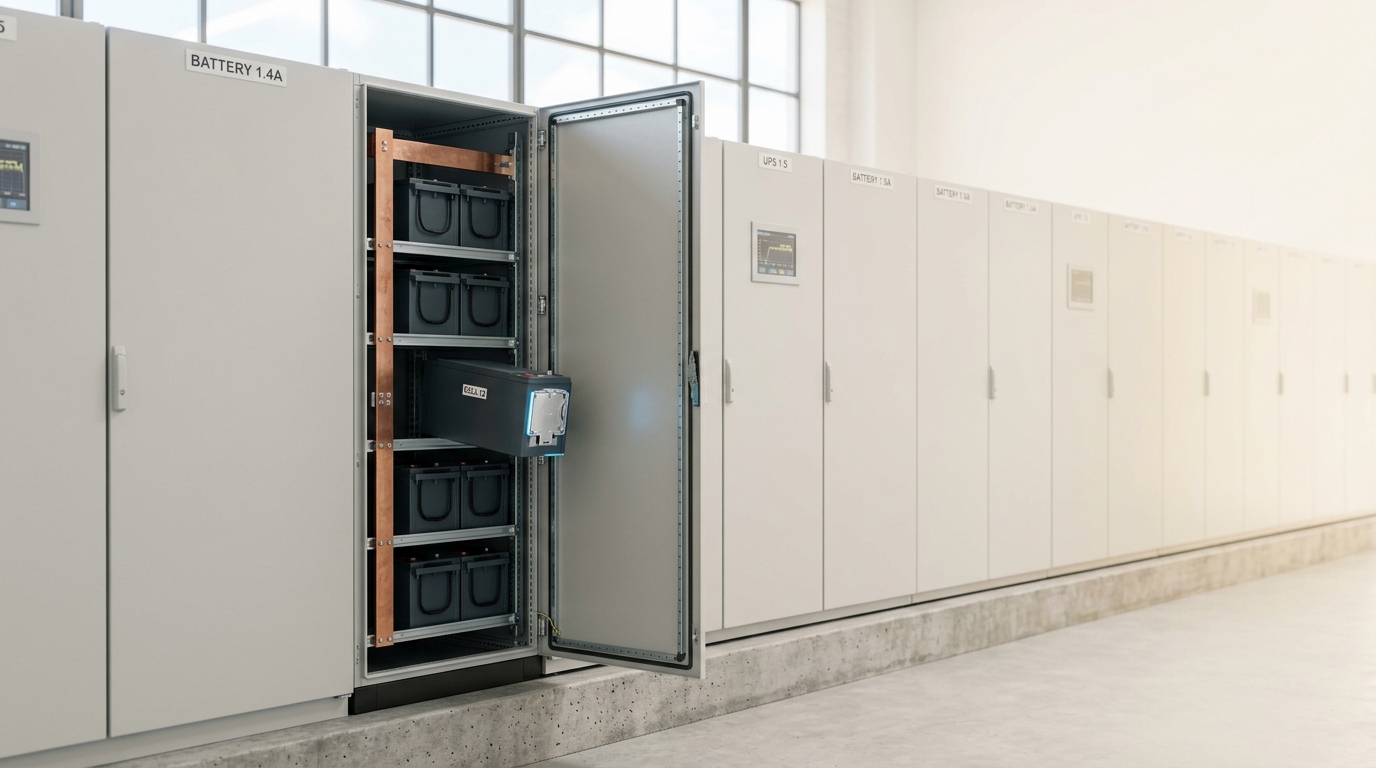
Trace the path a watt takes. It leaves a transmission line at a grid interconnect, passes through the utility’s side of a substation, and reaches the site at transmission or sub-transmission voltage. On-site step-down transformers bring it to medium voltage, typically distributed around the campus in a ring or radial arrangement. Medium-voltage switchgear sections that distribution so that a fault or a maintenance outage takes down a block rather than a campus. Further transformers step down to utilisation voltage at each data hall. There the power enters the uninterruptible power supply — historically double-conversion UPS with battery strings, increasingly lithium-ion, and in the largest designs a rack-integrated battery backup unit that pushes ride-through down to the shelf level. Downstream of the UPS sit distribution boards, busway or busbar runs, rack power distribution units, and finally the power supplies inside the equipment itself.
Every one of those stages has a conversion efficiency below unity, a fault-current rating, a lead time, and a physical footprint. The stage that determines whether a site exists at all, however, is the first one.
Grid interconnection is a queued, adjudicated process, and the queue is the constraint. Berkeley Lab’s Queued Up series, which aggregates interconnection queue data across the operators representing nearly all US generating capacity, reported roughly 10,300 projects actively seeking interconnection as of the end of 2024, representing about 1,400 GW of generation and about 890 GW of storage. The same analysis found the median duration from interconnection request to commercial operation had doubled, from under two years for projects built between 2000 and 2007 to over four years for those built between 2018 and 2024, and that only 13% of the capacity submitted between 2000 and 2019 had reached commercial operation by the end of 2024, with 77% withdrawn [7].
Read those three numbers together and the siting logic becomes obvious. A queue position is not a schedule; it is a lottery ticket with a multi-year expiry. The scarce asset is not land, capital, or accelerators — it is firm, delivered megawatts on a known date.
The equipment supply chain compounds this. The IEA’s April 2026 assessment records that supply chains for gas turbines and transformers “have tightened over the past year” and that “the swelling pipeline of data centre projects is straining planning and regulatory systems, holding up grid connections” [2]. Its earlier full report is blunter about the consequence: unless grid risks are addressed, the IEA estimates “around 20% of planned data centre projects could be at risk of delays” [1].
The scale context matters for calibrating all of this, and it is the statistic most often mangled in public argument. The IEA puts global data centre electricity consumption at around 415 TWh in 2024, roughly 1.5% of world electricity, and projects it to “more than double to around 945 TWh by 2030” [1]. Its 2026 update reports that data centre electricity demand “soared by 17% in 2025” against global electricity demand growth of 3% [2]. These are facility-level totals for all data centres, not for AI alone, and they are projections rather than measurements. Quoting them as though they were AI-specific measured consumption is the single most common error in this literature.
Rack density, and the assumptions it broke
General-purpose datacenter design was calibrated on a rack drawing a few kilowatts. Raised floors, perimeter air handlers, hot-aisle containment, chilled water at 7 °C to a room-level coil — all of it presumed that heat left a rack in air, at a flow rate a person could stand next to.
That envelope has not moved as fast as the popular narrative suggests, and the survey evidence is worth stating precisely. Uptime Institute’s 2025 global survey found that more than 80% of responding operators said their facility has no racks above 30 kW, about the same share as the previous year; around one in eight facilities reported some racks in the 30 kW to 59 kW band; and while the survey identified cabinets exceeding 100 kW, it described them as “still rare” [3]. The distribution is flattening rather than shifting: densification is real but concentrated in relatively few sites, which is consistent with high-performance and AI training compute being clustered rather than distributed.
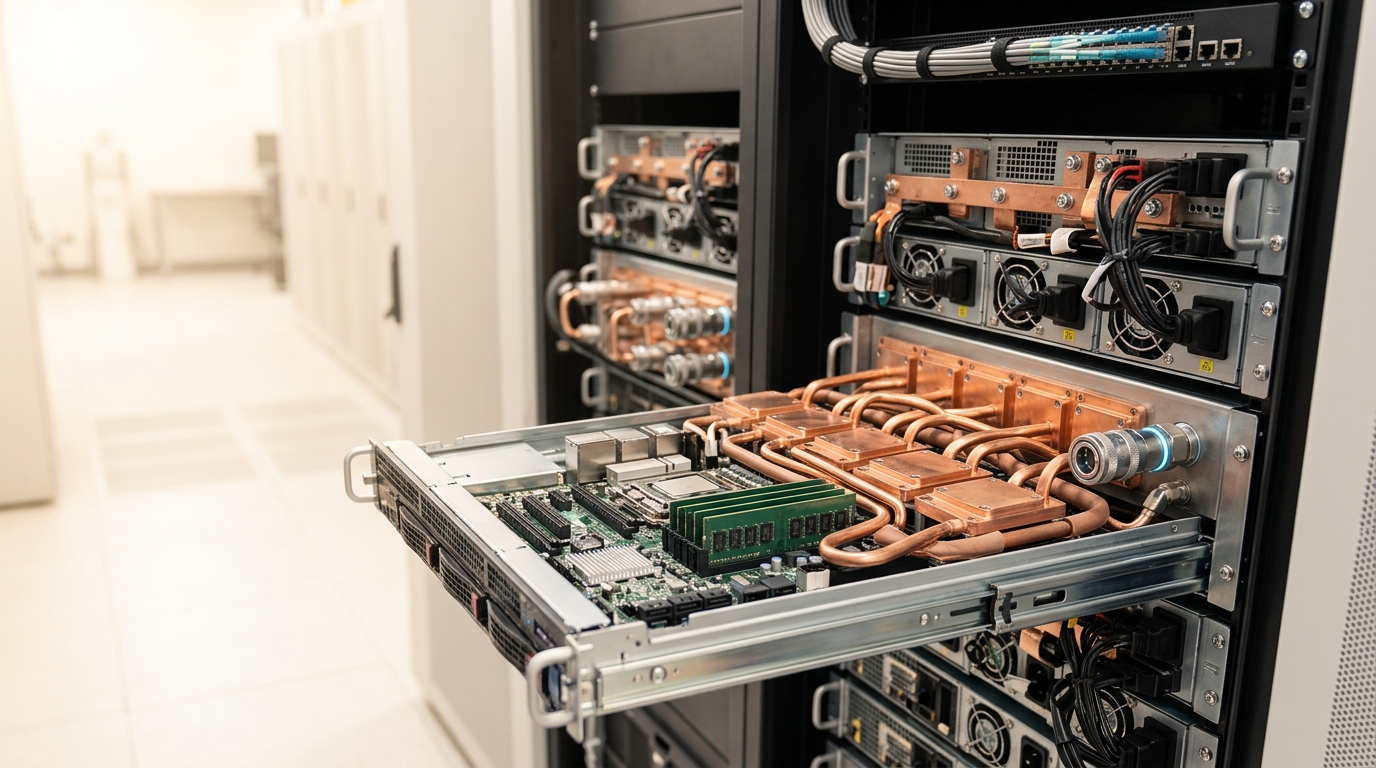
The concentration is what breaks the design. A rack-scale AI system is not a denser version of a general-purpose rack; it is a different object with a different thermal and electrical contract. NVIDIA describes its GB200 NVL72 as “36 Grace CPUs and 72 Blackwell GPUs in a rack-scale, liquid-cooled design” presenting a “72-GPU NVIDIA NVLink domain” with “130 terabytes per second (TB/s) of low-latency GPU communications” [8]. That is a vendor description, and it is worth noting what it does not contain: the product page states no rack power figure at all. The load such a rack presents to a facility is negotiated in system design documents, not published as a headline number — which is itself informative about who bears the integration risk.
The structural point is this. Once a single rack’s draw approaches the order of a small building’s service, the rack stops being a piece of furniture inside a power system and becomes a power system in its own right: its own busbar, its own conversion stage, its own protection coordination, and its own fluid connections. The unit of datacenter design shifts from the room to the rack, and every assumption keyed to room-level averages — floor loading, aisle geometry, air-handler sizing, breaker curves — has to be recomputed.
Why liquid stopped being optional
The reason liquid cooling arrived is not a preference for a technology. It is a property of air.
The rate at which a fluid stream removes heat is
with mass flow
The following is my own worked calculation, using standard property values rather than any cited source. At around 27 °C and atmospheric pressure, air has
ASHRAE’s Technical Committee 9.9 documented the consequences before the current cycle began. Its 2021 white paper records that the server industry had driven fan power down “from levels as high as 20% down to as low as 2% in some cases,” and that this trend has reversed: “a fan power percentage of 10% to 20% is not uncommon for some of the denser servers.” The committee spells out the arithmetic: “In a 50 kW rack, the fan power translates to be at least 5 kW,” and because server fans are fed from the same protected supply as the servers, “retaining air-cooled IT equipment while server fan power increases from 2% to 10% of the total server power equates to reducing the data center UPS capacity by 8%” [4].
That is the decisive framing. Beyond a threshold, air cooling does not merely become less efficient — it consumes the protected capacity you built the plant to sell. Fan power is paid for at the UPS, at the generator, and at the interconnect.
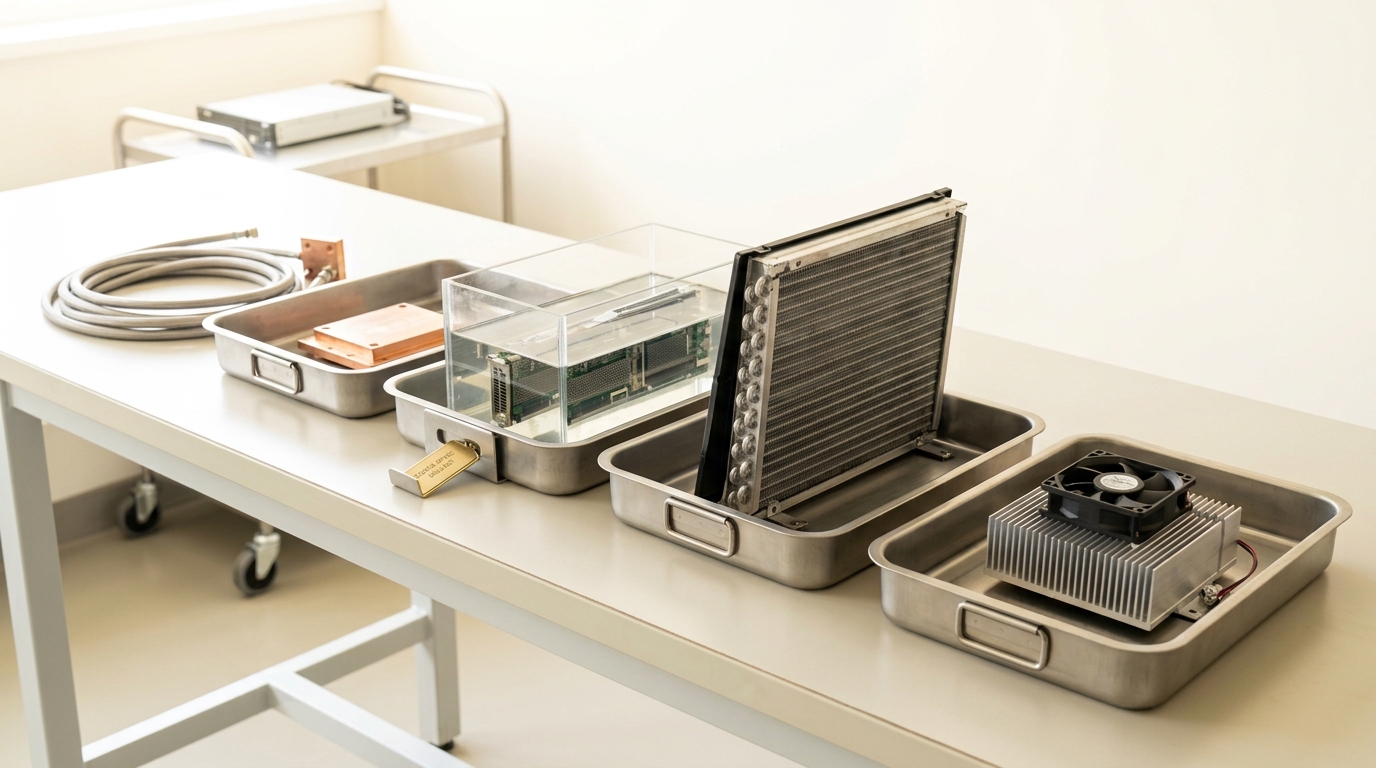
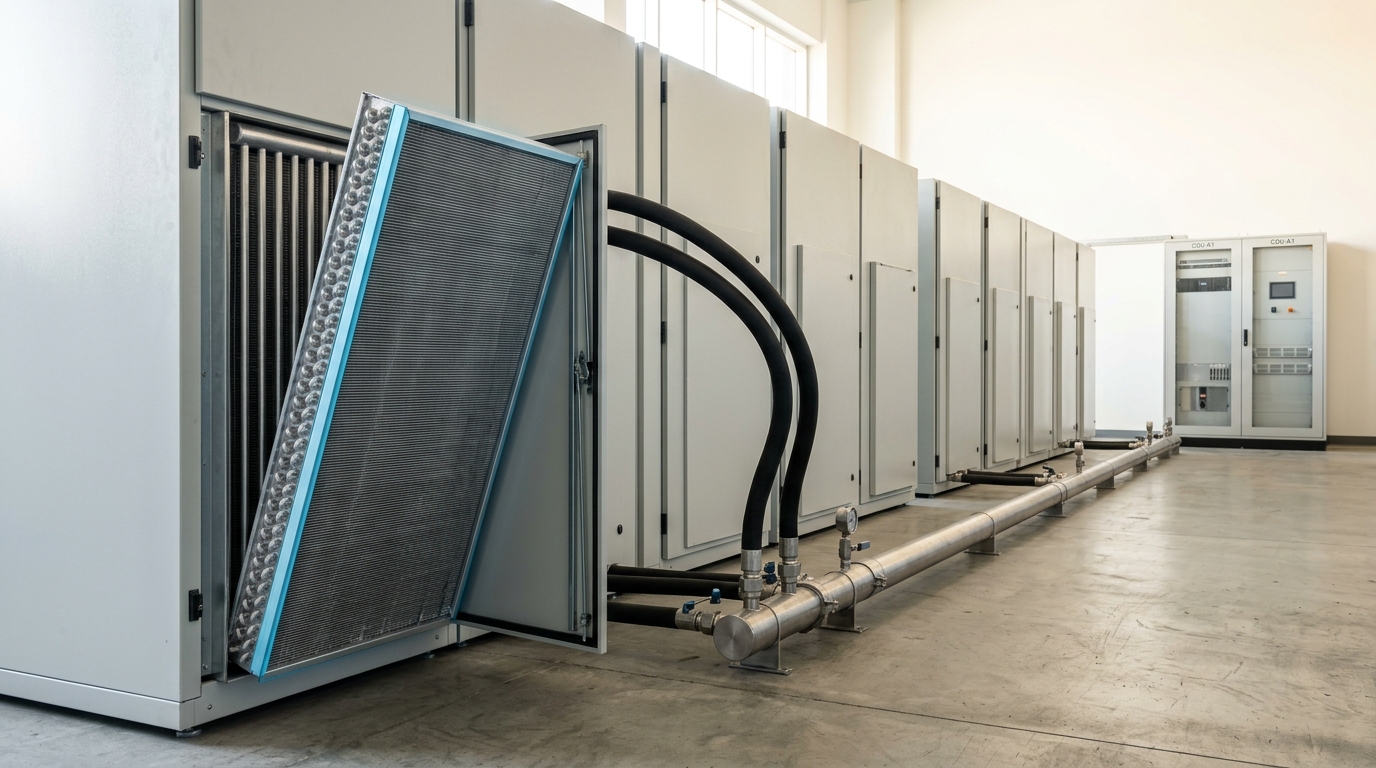
The intervention ladder is therefore ordered by how early in the path the heat is captured. Contained-aisle air with room or row units captures it last. Rear-door heat exchangers intercept the exhaust at the rack boundary and are the least invasive way to raise a room’s density ceiling. Direct-to-chip cold plates capture it at the package, where the temperature is highest and the transport is cheapest, and leave a residual air load for memory, drives and power supplies. Immersion submerges the whole assembly; ASHRAE notes its “benefits of broad temperature support, high heat capture, high density, and flexible hardware and deployment options” while flagging serviceability, fluid sealing and hardware-compatibility issues, and recommending “a materials compatibility assessment and warranty impact evaluation” before deployment [4].
Two facility-side consequences follow, and both are frequently missed. First, ASHRAE renamed its facility water classes to carry their upper temperature limits — W17, W27, W32, W40, W45 and W+ — and expects required facility water temperatures to fall over time as chip heat flux rises and case temperatures drop [4]. Warmer water is more efficient to produce; the trend is toward needing colder water. Second, hybrid air-and-liquid rooms carry a hidden penalty: “Because of the substantially lower heat capacity of air, liquid/air heat exchangers have much higher approach temperatures than liquid/liquid,” so an interim liquid-to-air bridge accelerates the very reduction in facility water temperature the operator was trying to avoid [4].
PUE, and the shape of what it hides
Power usage effectiveness is the industry’s one universally reported number:
Uptime Institute, which has collected the metric since its introduction by The Green Grid in 2007, reported a weighted average annual PUE of 1.54 across its 2025 respondent sample, “marking the sixth consecutive year that this headline figure has virtually stood still.” Beneath that flat average the sample separates: facilities commissioned within five years of the survey averaged 1.48, facilities of 20 MW and above averaged 1.44 globally, and 15% of respondents reported 1.3 or better [3]. Google, disclosing its own fleet, states that “in 2025, the average annual power usage effectiveness for our global fleet of data centers was 1.09,” measured as a trailing twelve-month figure “in all seasons, including all sources of overhead” [12].
The gap between 1.54 and 1.09 is partly real engineering and partly boundary definition, and that is exactly the metric’s problem. PUE is a ratio whose denominator is whatever the reporter counts as IT load. Uptime states the limitation plainly: PUE “excludes important elements of efficiency from its scope, such as facility water use or IT efficiency” [3].
Three failure modes follow directly from the algebra, and they are analysis rather than sourced claim. One: moving a cooling function inside the IT boundary improves PUE. Server fans are counted in
PUE remains worth reporting. It is simply an overhead ratio for one facility over one year, and it cannot bear the weight of being an efficiency metric for AI.
Water, and the trade it makes against energy
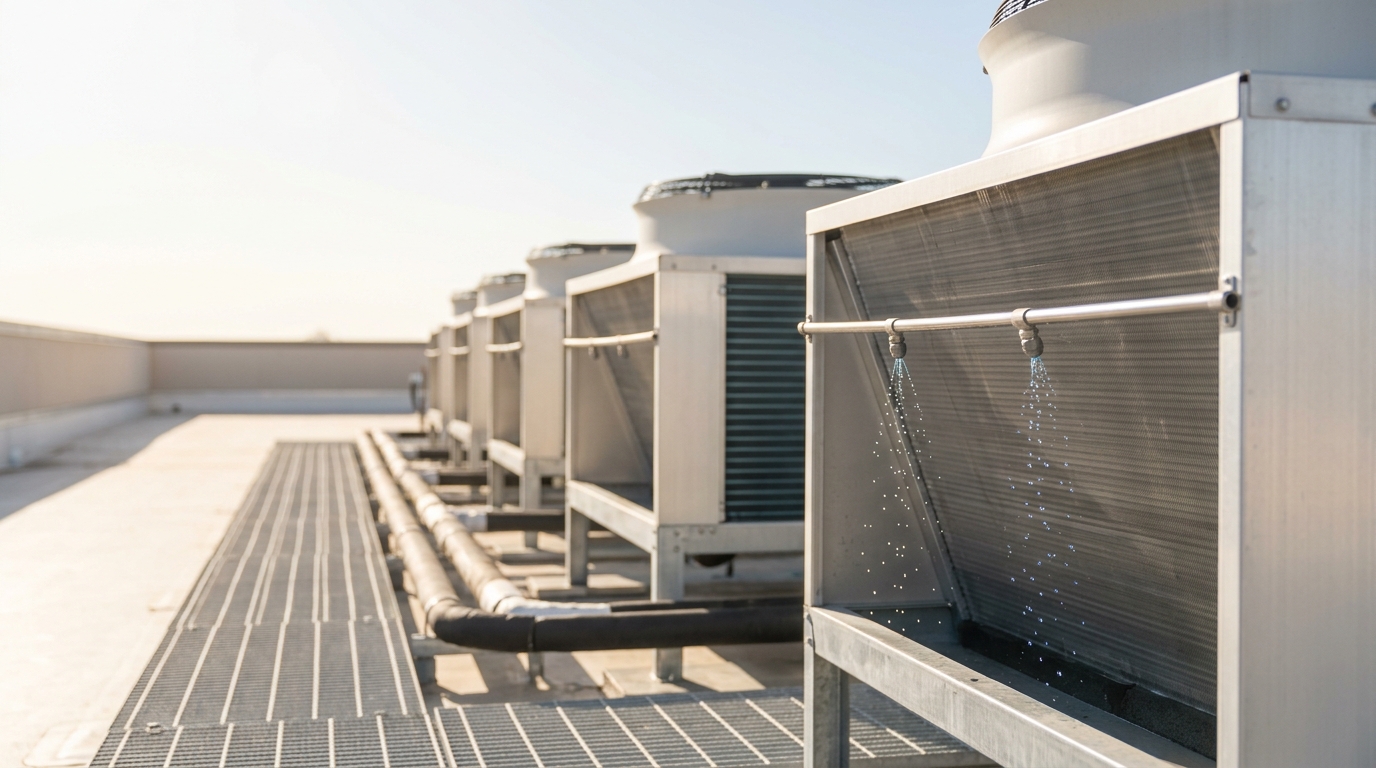
Heat rejection has two thermodynamic routes to the environment: sensible transfer to ambient air, or latent transfer through evaporation. Evaporative rejection is far more effective per unit of fan and compressor energy, because it works against the wet-bulb rather than the dry-bulb temperature. It also consumes water. This is not an incidental externality; it is a dial, and every operator sets it.
The scale of the consequence is documented. Siddik, Shehabi and Marston’s spatially resolved study estimated the direct, on-site water consumption of US data centers in 2018 at
Per-unit disclosures make the magnitudes concrete at the other end of the scale. Google’s own measurement paper reports a median Gemini Apps text prompt consuming 0.24 Wh of energy and 0.26 mL of water, on a boundary that “accounts for the full stack of AI serving infrastructure — including active AI accelerator power, host system energy, idle machine capacity, and data center energy overhead” [13]. That last clause is what makes the figure comparable to anything; per-prompt numbers published without a stated boundary are not measurements.
Note what PUE does to this trade: a site that switches from air-cooled chillers to evaporative rejection will report an improved PUE and an increased water draw, and the reported metric will register only the improvement. Uptime observes that water usage is the only sustainability metric whose reporting rate grew in its 2025 sample, driven substantially by regulatory requirements [3]. The metric follows the mandate, not the physics.
The fabric, and why it constrains where a job may run
The third plant system is the network, and AI training traffic does not resemble the traffic datacenter fabrics were designed for.
Training communication is dominated by collective operations — AllReduce, AllGather, ReduceScatter, AlltoAll — whose pattern is set by the parallelism strategy rather than by anything the application chooses. Meta’s production study, drawing on statistics from roughly 30,000 randomly selected training jobs, reports that data-parallel training uses AllReduce while fully sharded approaches use AllGather and ReduceScatter, and that message sizes vary widely across models [6].
The cost structure of a collective is arithmetic, not policy. For a ring AllReduce over
so bandwidth cost saturates near
The traffic this produces is pathological for conventional load balancing. Meta describes it as exhibiting “low entropy in the UDP 5-tuple” — few flows, repetitive and predictable — combined with burstiness at millisecond granularity and elephant flows where “the intensity of each flow could reach up to the line rate of NICs” [6]. Equal-cost multipath hashing, which relies on flow diversity to spread load, has almost nothing to hash on.
Topology then becomes a scheduling constraint rather than a plumbing detail. Meta’s backend network separates training traffic onto its own fabric and organises racks into a two-stage Clos “AI Zone” with rack-level leaf switches and modular spine switches at 400G. Zones are non-blocking internally, but “the cross-AI zone connectivity is oversubscribed by design,” and the response is explicitly a placement policy: the scheduler was enhanced “to find a ‘minimum cut’ when dividing the training nodes into different AI zones, reducing the cross-AI zone traffic and thus collective completion time,” by “learning the position of GPU servers in the logical topology to recommend a rank assignment” [6]. The reported scale gives the constraint teeth: “a large variant of Llama3 was trained on 16,000 GPUs on our RoCE cluster of 24,000 GPUs” [6].
The generalisation is that in an AI datacenter, a job’s rank assignment is a physical-layout decision. Two identically specified clusters with different oversubscription ratios do not run the same job at the same speed, and the difference is invisible in any procurement document that lists only accelerator counts.
Two load profiles sharing one building
The final structural fact is that “AI load” is two different loads with almost opposite properties, and conflating them produces bad plant design.
Training is a synchronous, batch, long-running job. Its power signature is coordinated. Patel and colleagues, profiling both server-level and production clusters, report that “LLM training clusters incur massive and coordinated power peaks due to large-scale synchronous training jobs” and consequently “offer a very small headroom (about 3%) to oversubscribe power.” They observe that peak draw “often reaches or exceeds” device TDP, and that iteration boundaries produce large synchronised swings — in their measurements one model held 75% of TDP at the boundary, another dropped to 50%, and a third fell to 20%, the idle power of the GPUs [10]. Thousands of accelerators executing the same step in lockstep make those swings correlated across the whole hall, which is a power-quality problem before it is an efficiency problem.
Against that, training is schedulable. It tolerates latency to the user because there is no user. Google’s carbon-intelligent compute system exploits exactly this, generating day-ahead “Virtual Capacity Curves” that “impose hourly limits on resources available to temporally flexible workloads while preserving overall daily capacity,” delaying flexible work to lower-carbon hours [9]. A load that can be delayed by hours and moved between regions is, from the grid’s perspective, a fundamentally different customer.
Inference inverts every one of those properties. It is latency-bound: a user is waiting, and the service level is expressed in time-to-first-token and inter-token latency. It is therefore geographically pinned near demand, because the speed of light in fibre is not negotiable. And it is near-continuous, following a diurnal demand curve rather than a job schedule. The same authors find that inference clusters, despite high server-level peaks, “offer substantial power headroom (about 21%) at the cluster level,” because request arrivals are statistically independent and de-correlate the aggregate — headroom their POLCA framework converts into roughly 30% more provisioned server capacity in the same electrical envelope [10].
Inference also has internal structure worth designing for. The Splitwise work characterises an inference request as “a compute-intensive prompt computation, and a memory-intensive token generation, each with distinct latency, throughput, memory, and power characteristics,” and reports that splitting these phases across differently provisioned hardware yielded “1.4x higher throughput at 20% lower cost” or “2.35x more throughput with the same cost and power budgets” [11]. Those are the authors’ measurements on their configurations, not a general law.
Put the two profiles side by side and the plant implications are direct. A training campus can be sited where power is cheap and abundant, can accept interruptible or curtailable service, and must be engineered for correlated swings. An inference fleet must be sited where the users are, must be engineered for high availability and near-constant draw, and can be more aggressively oversubscribed. A single design brief that tries to serve both will over-build one and under-serve the other.
Predictions, with the observations that would falsify them
These are forecasts, separated from the sourced analysis above. Horizon: 8 August 2029.
One. Interconnect position and delivered-megawatt schedules will be disclosed as a standard element of large AI infrastructure announcements, because capacity claims without them will have become non-credible. Disconfirmed if major buildout announcements in 2029 still lead with accelerator counts and floor area alone.
Two. Facility water supply temperatures for new AI halls will trend colder rather than warmer over this period, following chip heat flux, despite the efficiency incentive to run warm. Disconfirmed if new liquid-cooled halls are predominantly specified at W40 or above.
Three. PUE will be formally supplemented rather than replaced — reported alongside a water metric and a delivered-work metric — because its boundary problems are structural and widely understood. Disconfirmed if PUE remains the sole headline efficiency disclosure in majority practice, or if it is abandoned outright.
Four. Training and inference estates will diverge physically, with distinct siting criteria, distinct electrical service classes, and distinct cooling specifications, rather than converging on one general-purpose AI datacenter design. Disconfirmed if the dominant new-build pattern is a single fungible design serving both.
None of these requires a technology discontinuity. Each follows from constraints already visible in the sourced material above.
What to take away
The building is the engineering object. Power arrives through a queue that takes years and grants no guarantees; it is conditioned through a chain of conversions each of which takes a cut; it becomes heat at a density that air can no longer carry; that heat leaves through a route that trades water against electricity; and the computation itself is organised by collective operations whose completion time is set by a topology decision made when the fabric was poured.
Every one of those constraints is upstream of the accelerator. Choose the wrong interconnect and the site never runs. Choose the wrong heat-rejection route and the density ceiling arrives two generations early. Choose the wrong fabric and the job runs at the speed of its slowest cut. Choose the wrong load profile for the site and you have built a plant for a customer you do not have.
A powerhouse is bounded by its head and its tailrace, not by the machines in the hall. An AI datacenter is bounded by its interconnect and its heat rejection, not by what is in the racks. The computing, in the end, is the easy part.