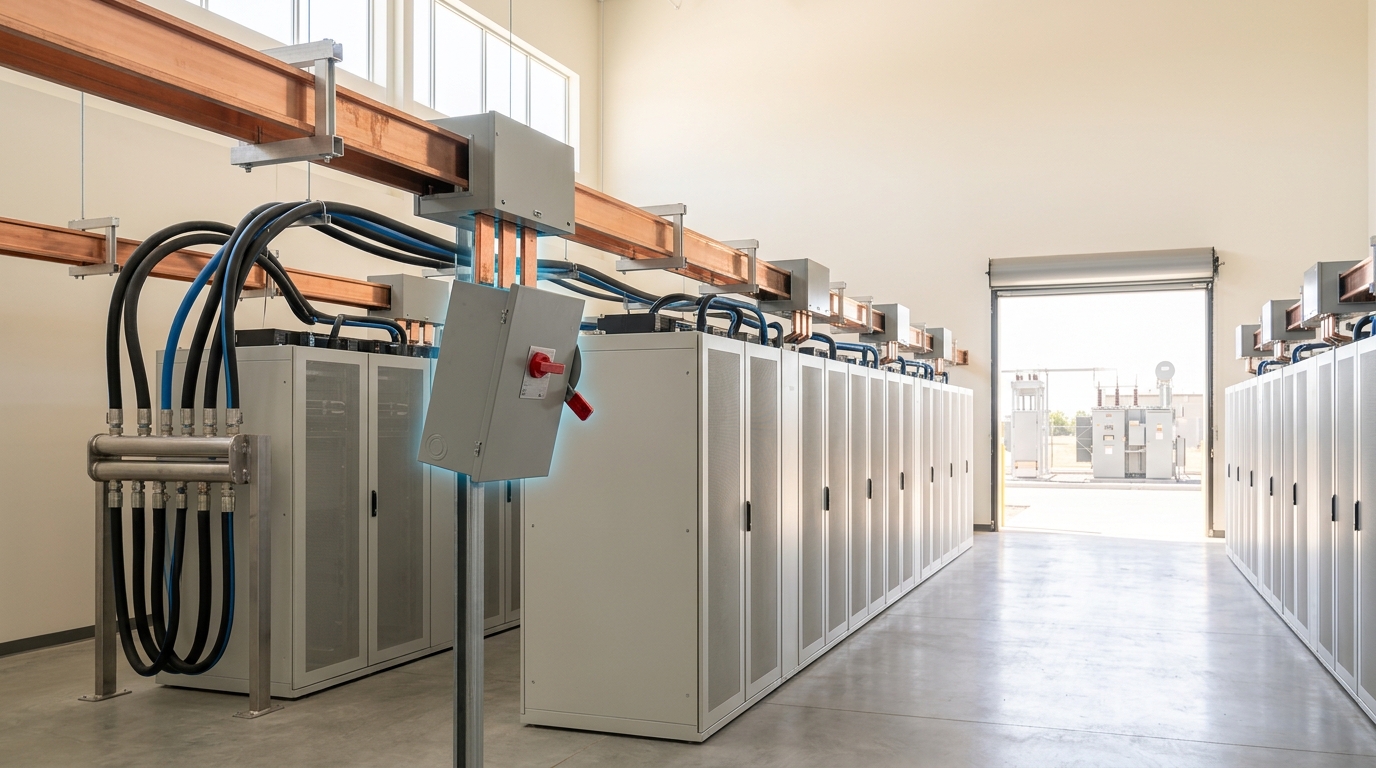
Four gates, not one build
The public conversation about AI datacenters treats construction as a single event: a shell goes up, racks go in, the site switches on. Anyone who has actually commissioned one of these facilities knows the building is the easy part. What determines whether it runs on schedule, stays connected to the grid, and survives its first hard fault is a sequence of separate qualification gates, each with its own paperwork, its own test procedure, and its own way of failing quietly until it fails loudly.
This article is written from that operational vantage point. It assumes you already know an AI datacenter needs power and cooling; it is about the four things a project team actually has to do to get those systems trusted: navigate a grid interconnection study, commission a liquid-cooling loop, instrument power quality, and qualify the site for demand-response participation. A closing section follows the same commissioning choices into the sustainability metrics — water, heat reuse, carbon accounting — that outlive the build, and a final section collects the failure modes that recur across teams doing this at speed.
The scale context is worth stating once, because it explains why every gate below has gotten harder rather than easier. The International Energy Agency puts global data centre electricity consumption at roughly 415 terawatt-hours in 2024, projected to more than double to around 945 TWh by 2030 [1]. Its most recent update reports that data centre electricity demand rose 17% in 2025 against global electricity demand growth of only 3%, driven by AI-focused capacity, while hyperscaler capital expenditure exceeded 400 billion US dollars in 2025 and is projected to rise a further 75% in 2026 — a pace the agency says is “straining planning and regulatory systems” for gas turbines, transformers, chips and grid connections alike [2]. Every gate that follows is being cleared inside that squeeze, not in a calmer market that no longer exists.
Navigating a grid interconnection study
The interconnection study is where most projects lose their first year, and the discipline that matters here is treating a queue position as a lottery ticket with a multi-year expiry, not a schedule.
Lawrence Berkeley National Laboratory’s Queued Up series aggregates interconnection queue data from the operators covering nearly all US generating capacity. Its most recent edition reports that the median duration from interconnection request to commercial operation has doubled — from under two years for projects reaching commercial operation between 2000 and 2007, to more than four years for those completed between 2018 and 2024. Of the capacity that requested interconnection between 2000 and 2019, only 13% had reached commercial operation by the end of 2024; 77% had been withdrawn and the remainder was still active in the queue [4]. Those numbers describe generation projects, but a large load request enters the same adjudicated process, competing for the same limited engineering study capacity and the same constrained equipment supply chain.
Grid operators are visibly reworking that process around exactly this pressure. PJM’s Markets and Reliability Committee has approved a “connect-and-manage” framework as an interim mechanism for integrating large-load customers ahead of new generation being built, with a dedicated Senior Task Force beginning work in spring 2026 and a target of having the framework operational by the end of the year. The proposal on the table gives a prospective large load three ways to earn faster or firmer interconnection: accept curtailment instructions during constrained periods, provide backup generation or storage the operator can call on, or wait for conventional transmission upgrades to clear [5]. Read plainly, that is the grid operator telling large loads that speed is for sale, and the currency is flexibility, not cash.
The practical implication for a project team is to walk into the interconnection study with an answer to the flexibility question already prepared, not improvised after a study comes back unfavorable. A load that can credibly commit to shedding or islanding onto backup power during a small number of system-critical hours moves through review differently than one that cannot, because it changes what a system impact study has to prove. Reliability regulators are pushing in the same direction from the supply side: after a run of incidents in which more than a gigawatt of computational load disconnected from the grid within seconds, the continent’s reliability body issued its third-ever highest-severity alert in May 2026, directing transmission planners to obtain detailed modeling data from large computational loads, run annual stability-margin studies in areas with concentrated data centre load, and install dynamic fault-recording devices to monitor how these facilities actually behave during a disturbance [6]. A project that shows up to its interconnection study already able to supply that modeling data — a realistic ride-through profile, not a vendor datasheet — clears review faster than one the transmission planner has to chase for it.

Commissioning a liquid-cooling loop
A cooling loop that has been installed correctly and a cooling loop that has been commissioned are different objects, and the gap between them is where most early liquid-cooling incidents originate.
The facility side of the commissioning problem starts with a temperature and chemistry contract that ASHRAE’s Technical Committee 9.9 has been actively rewriting as chip heat flux has risen. The committee’s facility water classes — renamed to carry their upper supply-temperature limits directly, as W17, W27, W32, W40, W45 and W+ — describe supply water from 17°C up through 45°C and beyond, and the committee’s own guidance is that required facility water temperatures are trending colder over time as denser packages push case temperatures down, even though warmer water is thermodynamically cheaper to produce [9]. That single fact reshapes a commissioning plan: a coolant distribution unit specified against last year’s warm-water target can be a cold-water liability two hardware generations later, and the acceptance test has to check the loop against the temperature class the rack actually needs, not the one the building was designed around.
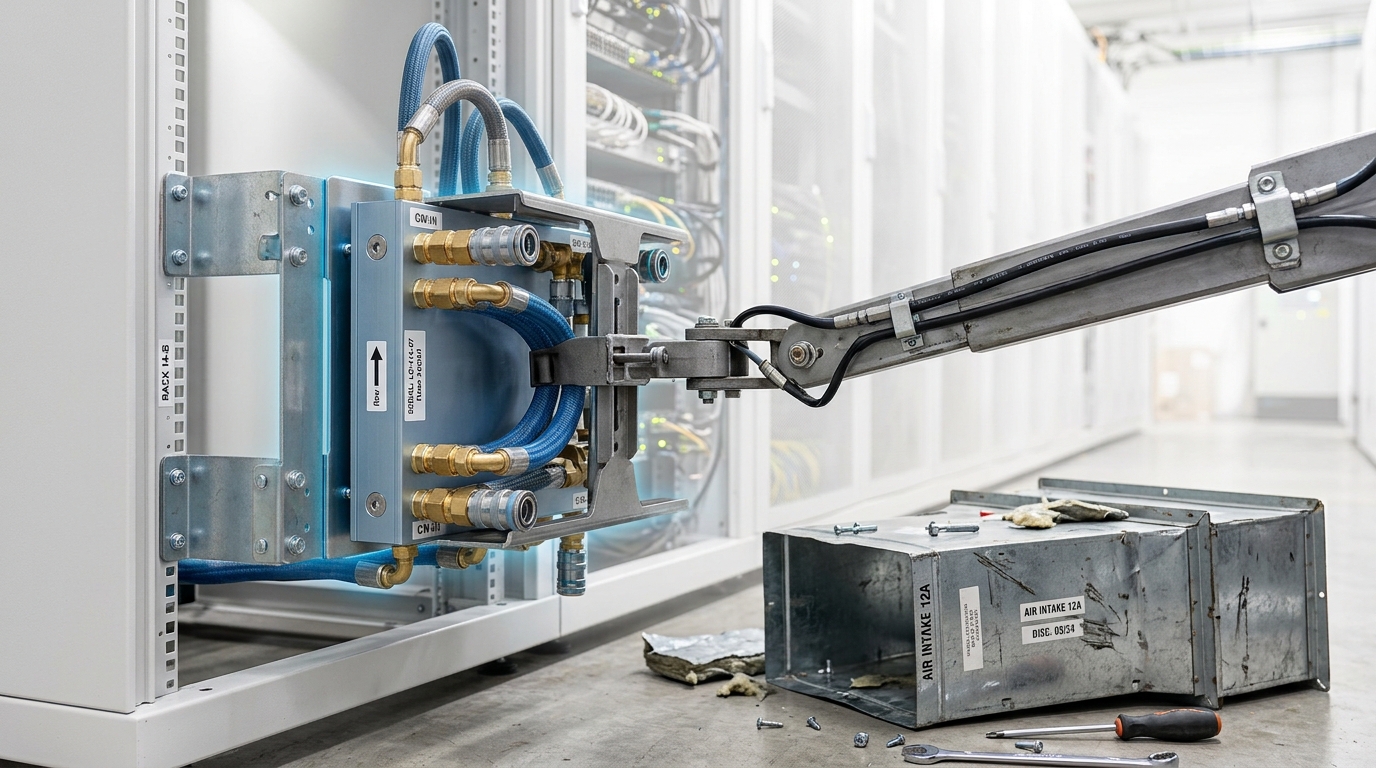
ASHRAE’s guidance also separates the facility water system from the technology cooling system as a matter of design discipline, not merely nomenclature — the loop that touches the chip is not the loop that touches the chiller plant or the dry cooler, and the boundary between them, usually a heat exchanger inside the coolant distribution unit, is where commissioning has to prove two different fluid qualities meet their two different specifications [9]. In practice that means the technology cooling system loop is commissioned against particulate, dissolved-solids and conductivity limits tight enough to protect cold plates and blind-mate couplings with no serviceable filtration downstream, while the facility water system is commissioned against the coarser tolerances of a conventional chilled-water plant. Conflating the two acceptance criteria — running the whole loop to the facility-side standard because it is faster to test — is a documented failure mode, not a hypothetical one; it is precisely the boundary the industry’s own guidance calls out as needing separate treatment.
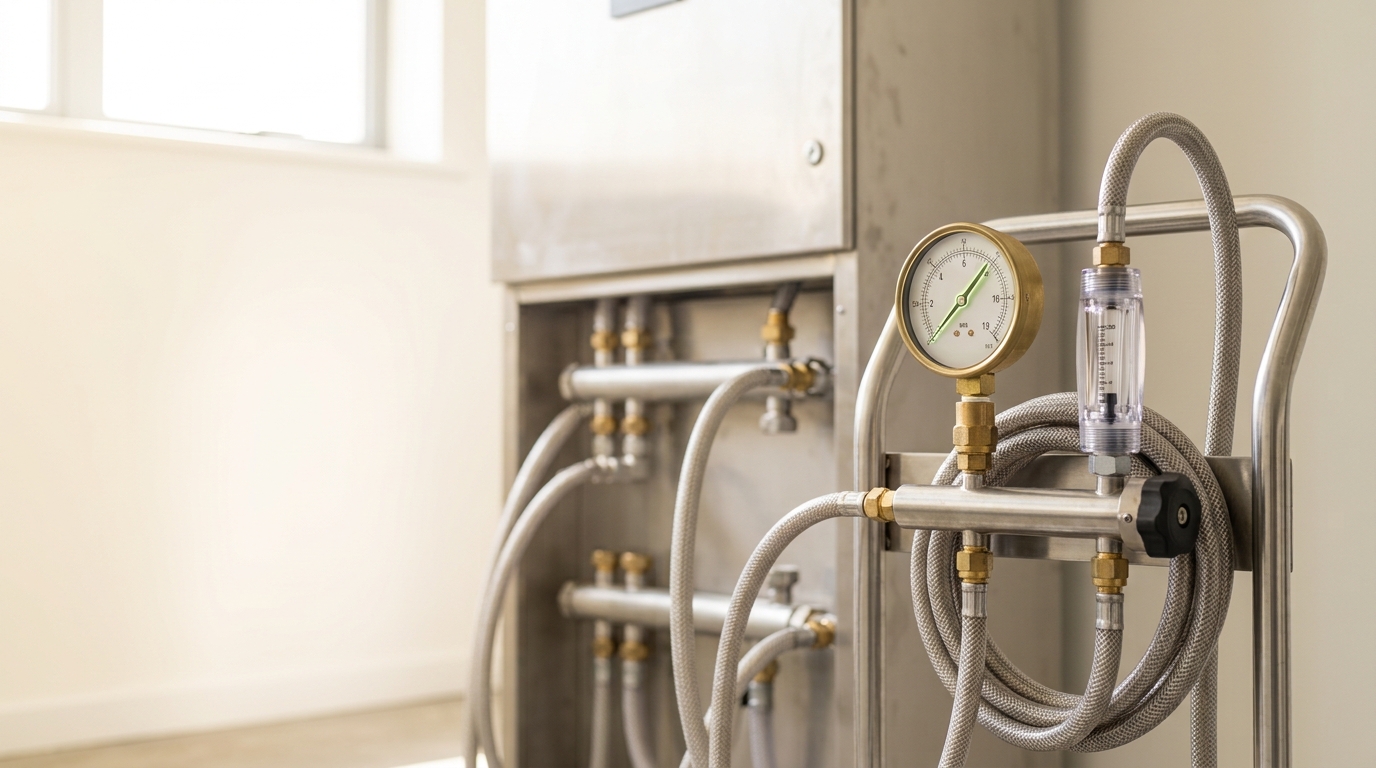
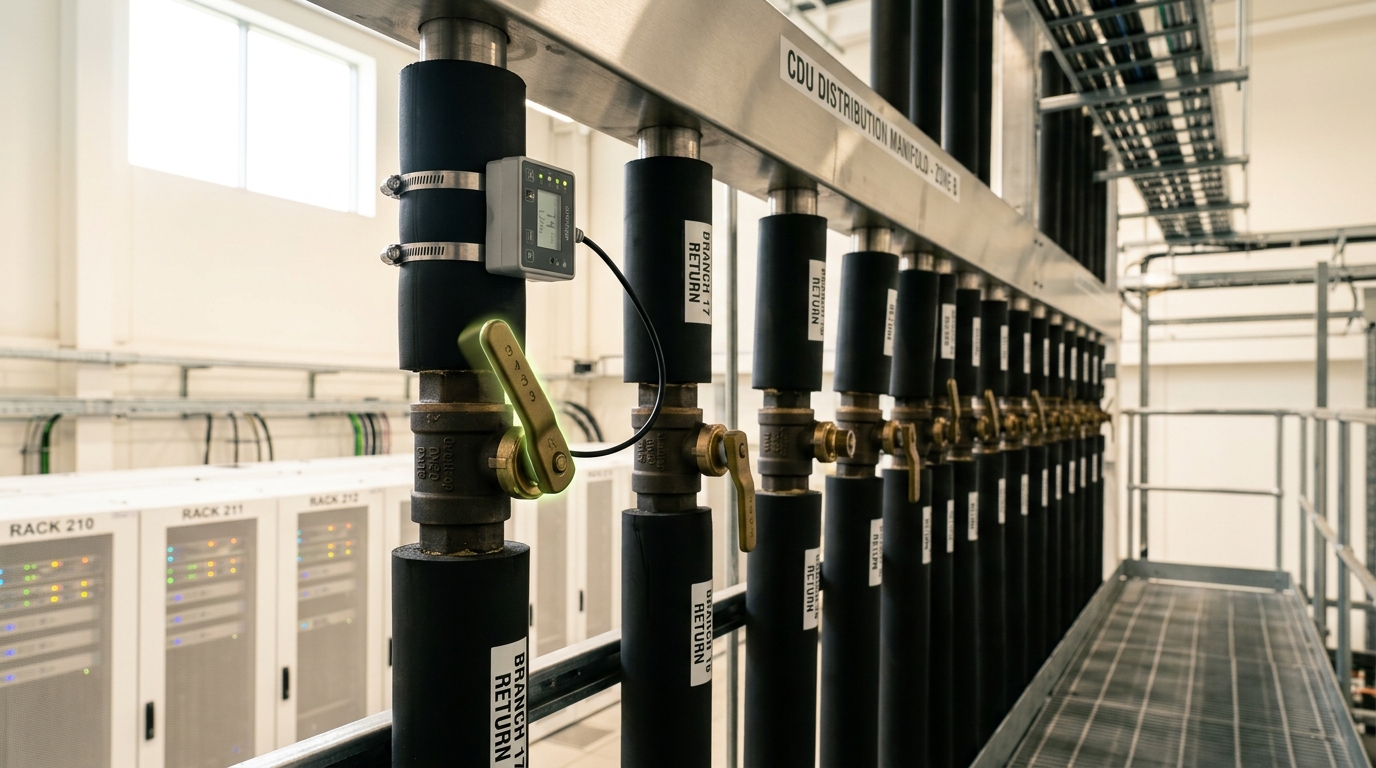
The commissioning sequence that follows from this is unglamorous and easy to compress under schedule pressure: fill and flush until particulate and conductivity readings meet the technology cooling system’s own target, not the facility water system’s looser one; hold the loop under pressure long enough to expose a slow leak rather than only a catastrophic one; verify flow at every branch of the distribution manifold rather than trusting the coolant distribution unit’s rated total flow, because an unbalanced manifold can starve the last rack in a row while the pump reports nominal output; and only then bring IT load onto the loop. Because this facility infrastructure is still comparatively rare — Uptime Institute’s global operator survey found more than 80% of respondents run no racks above 30 kW, with cabinets above 100 kW still described as rare across the sample [14] — many project teams commission their first high-density liquid loop with a commissioning workforce that has done it only once or twice before, which is the single best predictor of a rushed acceptance test.
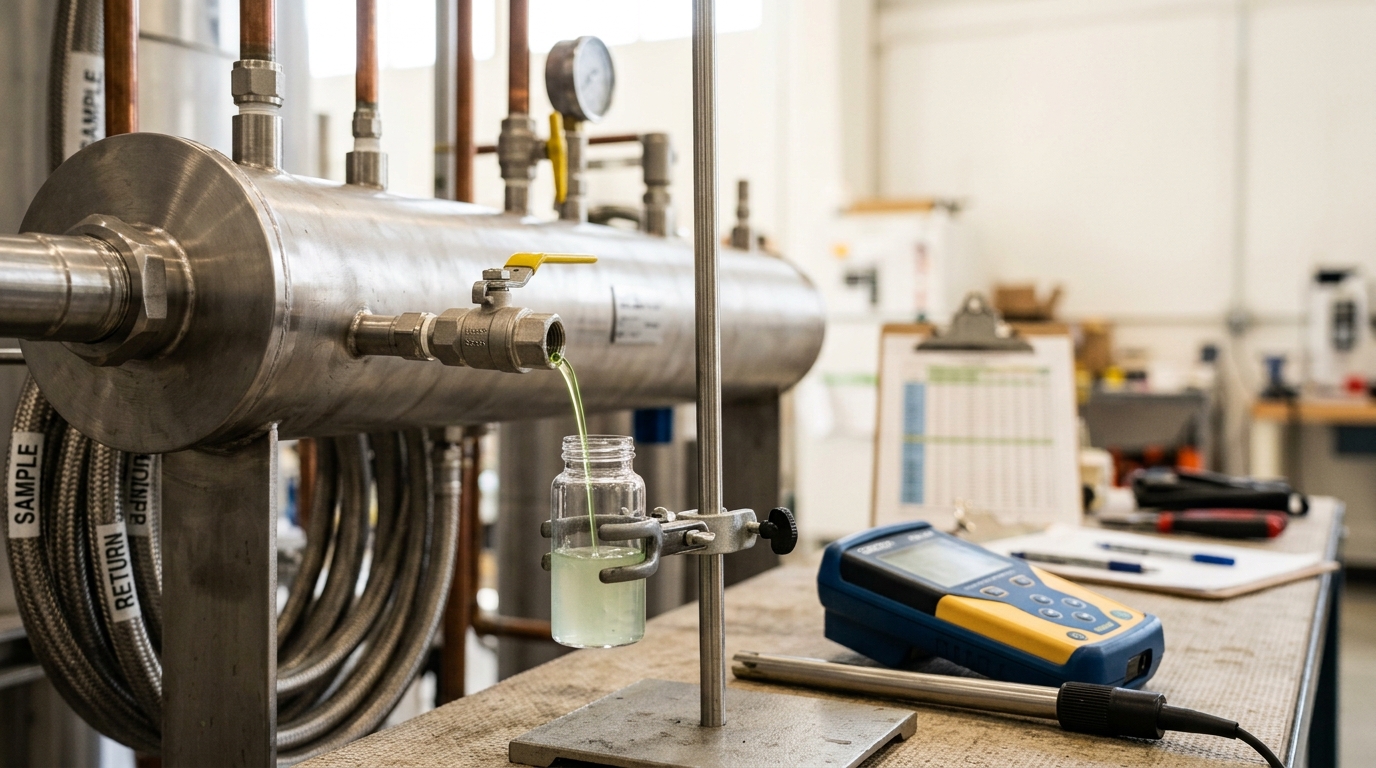
Flow balancing is the step most often skipped once particulate and pressure pass, because a loop that circulates at its rated total flow looks finished. It is not. A manifold feeding a dozen racks in parallel divides flow according to the hydraulic resistance of each branch, and unless every balancing valve is set individually against a measured branch flow, the racks nearest the pump run cool while the racks at the far end of the row run hot at exactly the load the rack was specified to handle. This is a one-time commissioning task with a permanent consequence: an unbalanced manifold discovered after IT load is live means re-balancing a live loop, which is a materially harder and riskier operation than balancing an empty one.
Setting up power-quality monitoring
Power quality on an AI campus is not a generic industrial-load problem with a bigger number attached. The load shape is qualitatively different from what utility protection and site electricians were designed around, and the instrumentation plan has to be built for that difference rather than inherited from a conventional datacenter.
The physical reason is well characterized in the research literature by now. Patel and colleagues, measuring both individual servers and production GPU clusters, report that large-scale synchronous training jobs produce “massive and coordinated power peaks,” with iteration boundaries — the instant thousands of accelerators simultaneously finish a compute phase and enter a communication phase, or vice versa — producing power swings that in their measurements ranged from roughly 20% of thermal design power up to 75% or more, correlated across the entire job rather than averaged away by scale [10]. A recent survey of AI datacenter grid interactions extends this from the rack to the interconnection point, arguing that the demand swings characteristic of large training runs propagate into voltage and frequency effects at the point of common coupling that conventional planning studies, built around slower and less synchronized industrial loads, were not designed to anticipate [8]. The regulatory record backs this up with an operational example rather than a model: reliability authorities have now documented multiple incidents in which more than a gigawatt of data centre load disconnected from the bulk power system within seconds, severe enough to warrant a top-severity industry alert in 2026 requiring, among other things, that large computational loads be individually instrumented with dynamic fault-recording equipment so operators can see what actually happened during a disturbance rather than reconstruct it after the fact [6].
The instrumentation baseline for a new site starts with IEEE 519, the North American reference for harmonic control, which frames the problem around the point of common coupling — the interface between the utility and the customer — and assigns the utility responsibility for background voltage distortion while assigning the customer responsibility for the current distortion its own equipment injects [7]. The standard’s working measure of current distortion, total demand distortion, is the root-sum-square of harmonic currents up to the fiftieth order expressed as a fraction of the maximum demand current
a normalization that matters operationally because it means a monitor sampling only during a quiet period will systematically overstate a site’s distortion relative to its own historical demand baseline — one more reason a permanently installed analyser, not a periodic spot check, is the only instrument that produces a defensible reading.
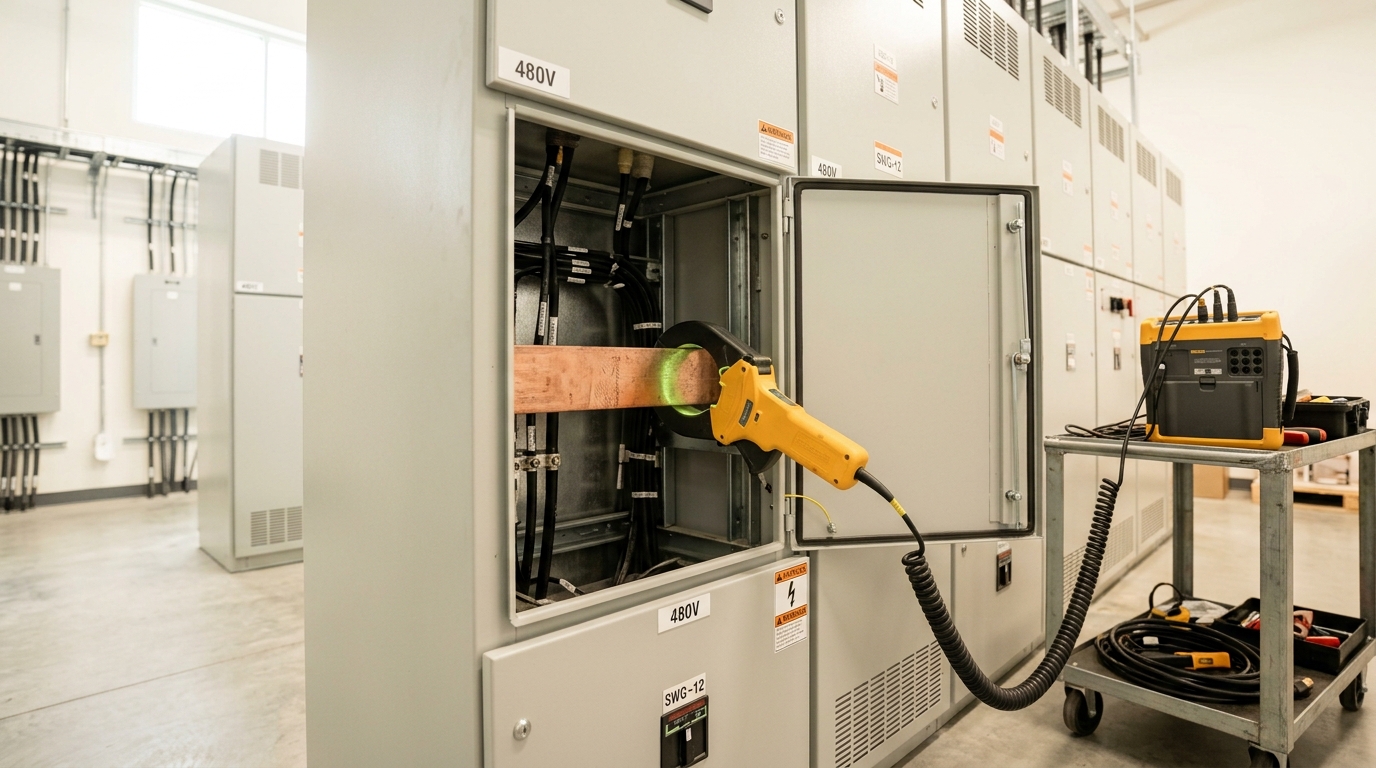
A workable monitoring plan therefore places instrumentation at three points rather than one: at the point of common coupling, to demonstrate compliance with the utility interconnection agreement under IEEE 519’s steady-state limits; downstream of the UPS, to characterize what the facility’s own conversion equipment is doing to the waveform; and at a sample of rack power distribution units feeding synchronized training pods, to capture the sub-second load transients that a PCC-level meter, sampling at a coarser interval, will average into invisibility. None of this is optional instrumentation to be added after an incident. Reliability authorities are moving toward requiring exactly this kind of disturbance-level visibility as a condition of continued interconnection, not as a courtesy the site extends to its utility [6].
Planning for load flexibility and demand-response participation
Every large load connecting to a constrained grid is now being asked, implicitly or explicitly, what it can give back during the hours the system is under stress. Treating that as a marketing question rather than an engineering one is the fastest way to promise a shed commitment the site cannot actually deliver.
The economic case for taking the offer seriously is straightforward and is being made by the market itself. With data centre electricity consumption headed toward a high-single-digit to low-double-digit share of US electricity by 2030, researchers cited in recent reporting on grid-enhancing technologies argue that demand response and dynamic load shaping are a materially cheaper lever for managing peak system cost than building generation that runs only during the hours in question — a “complementary lever for managing peak demand without relying on high-cost, low-utilization generation,” in the framing used by the underlying analysis [11]. PJM’s own connect-and-manage proposal makes the same trade explicit at the interconnection stage: a large load that pre-commits to curtailment or to serving itself from backup generation during a defined set of hours is offered a materially different — generally faster — path to a firm interconnection agreement than one that offers nothing [5].
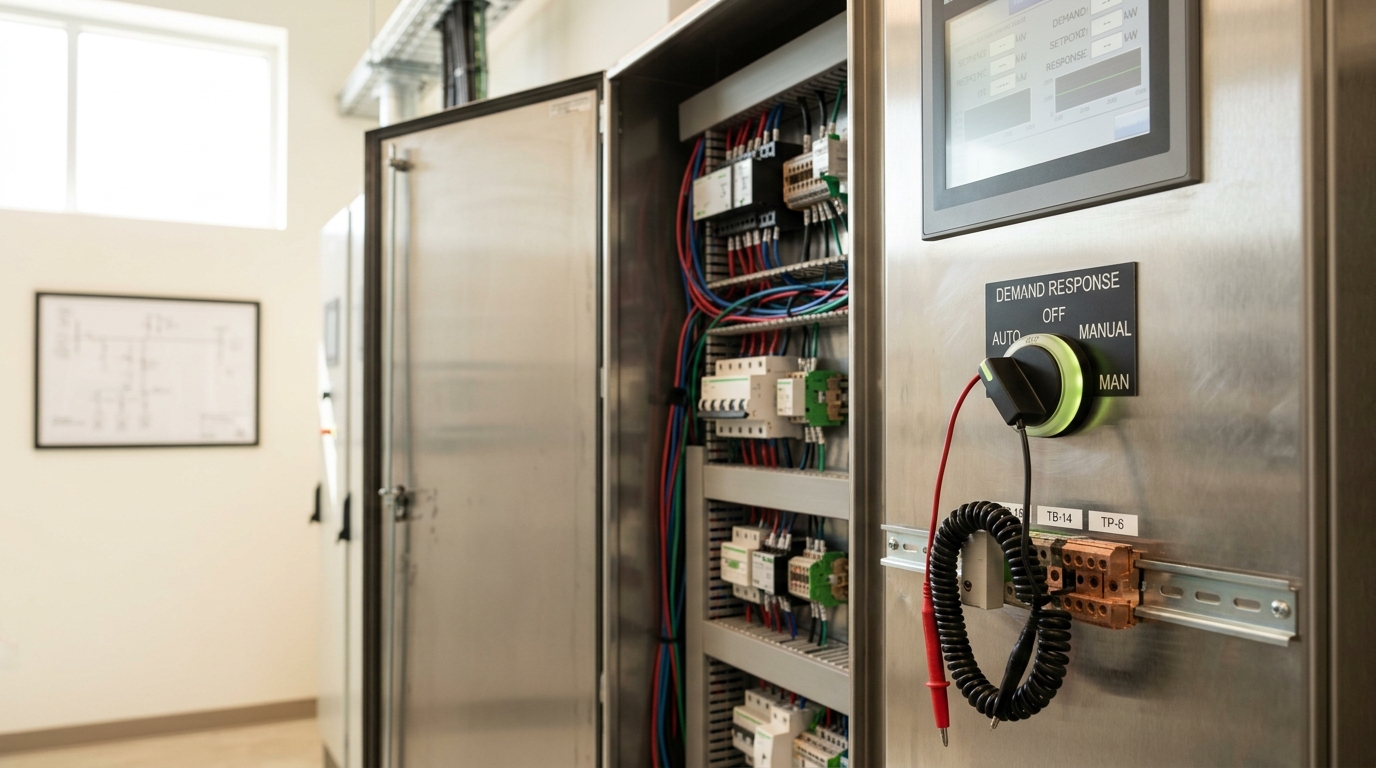
The engineering discipline that makes any of this credible is verification, not policy. A demand-response enrollment is a promise to a grid operator that a specific amount of load can be shed within a specific window, and that promise is only as good as the last time it was tested end to end — the control signal received, the setpoint applied, the load actually reduced at the meter, and the reduction sustained for the committed duration. Because AI training load is schedulable in a way inference load is not, the physical capability usually exists on a training campus; what fails in practice is the control chain connecting a grid signal to a scheduler action, not the underlying willingness of a training job to pause. A site that has only ever tested its demand-response configuration in a tabletop exercise, rather than by actually shedding load and confirming the reduction at the interconnection meter, does not know whether it can perform, and neither does the grid operator counting on it.
Water, heat reuse and the carbon-accounting overlay
The same choices made at the cooling-loop and load-flexibility gates resurface, months or years later, as sustainability disclosures — and the metrics used to report them have their own commissioning-adjacent details worth getting right the first time.
Water usage effectiveness, defined by The Green Grid as annual site water use divided by IT equipment energy, was built as a companion to power usage effectiveness specifically because evaporative cooling — the cheaper route to heat rejection in electrical terms — consumes water that a dry or liquid-to-liquid system does not [12]. A site that switches from evaporative rejection to a liquid-cooled, dry-coolant loop to cut its WUE has usually also changed its electrical load profile, and reporting the water number without the paired energy number obscures exactly the trade the metric was designed to expose.
Heat reuse is the newer overlay, and it is the one most directly downstream of the cooling-loop commissioning decisions described above, because a loop’s usable return temperature is fixed by the same coolant-class choice that governs its compressor-free operating hours. The IEA’s analysis of district heating notes that since nearly all the electricity a data centre consumes ultimately becomes heat, roughly 70–80% of it can in principle be recovered through heat pumps for reuse, and that if fully integrated into district networks, reused data centre heat could meet around 300 TWh of demand by 2030 — enough, on the agency’s estimate, for roughly 10% of European homes within a few kilometers of participating sites [3]. The same analysis is candid about the constraint that actually limits deployment: recovery technology exists and is already running at scale — more than twenty data centres already feed roughly 1.5% of Stockholm’s district heating demand, and waste heat committed in Espoo, Finland is sized to warm on the order of 100,000 homes — but scaling it further depends on business models and tariff structures for the heat itself, not on any remaining technical barrier [3]. A cooling loop commissioned to a warmer facility-water class produces a heat stream a district network can actually use without a heat pump in between; one commissioned to the coldest class available produces a stream that is more efficient to make on-site and less useful to anyone downstream. That is a design decision made once, at commissioning, with consequences that show up years later in a heat-offtake negotiation.
Carbon accounting sits over both of these physical choices as a reporting layer with its own standard and its own live disagreement. The GHG Protocol’s Scope 2 Guidance requires companies to report purchased-electricity emissions by two parallel methods: a location-based method using a grid-average emissions factor for the region of consumption, and a market-based method that allows contractual instruments — supplier-specific factors, energy attribute certificates, power purchase agreements — to substitute a different factor for the same physical electricity [13]. The two methods can produce materially different reported emissions for an identical physical operation, and which one a datacenter’s demand-response and load-shifting program actually improves depends on which method governs the disclosure — location-based accounting rewards genuine reductions in grid-average draw during high-emissions hours, while market-based accounting can be satisfied through contractual instruments that leave the physical hourly load profile unchanged. A commissioning team that treats “the carbon number” as a single figure is setting up a future disagreement between whoever owns the physical demand-response program and whoever owns the sustainability disclosure; the two groups are not always optimizing the same quantity, and where they diverge should be stated rather than papered over.
Ten pitfalls teams keep hitting
Collected from the gates above, these are the specific ways schedule pressure turns a plan into an incident.
Sequencing power and cooling as independent workstreams. Energizing racks before the coolant loop has passed flow-balance acceptance, or completing loop commissioning long before the electrical system that will actually load it, both waste the narrow window when either system could still be adjusted cheaply.
Testing the loop against the facility water system’s tolerances, not the technology cooling system’s. It is faster and it is wrong, for the reasons the FWS/TCS separation exists in the first place [9].
Skipping branch-level flow verification because total flow reads nominal. The manifold does not know the pump’s rated output; it knows its own hydraulic resistance, and an unbalanced row runs hot at exactly the load it was specified to handle.
Commissioning power-quality instrumentation only after an incident. A monitor installed to explain what already happened cannot prevent the next one, and reliability authorities are moving toward requiring this instrumentation as a condition of interconnection rather than an optional add-on [6].
Sampling total demand distortion during a quiet period. Because TDD is normalized to maximum demand current rather than instantaneous load, a reading taken off-peak systematically understates the site’s real compliance margin.
Enrolling in a demand-response program without an end-to-end shed test. A tabletop exercise proves the paperwork; only an actual shed, confirmed at the interconnection meter, proves the control chain.
Sizing coolant chemistry and filtration for the coolant class in the room today, not the one the next hardware generation will require. ASHRAE’s own guidance is that required facility water temperatures are trending colder, not warmer, which is the opposite of what efficiency incentives alone would suggest [9].
Treating water and carbon metrics as independent numbers rather than a linked pair. A WUE improvement bought by shifting rejection load onto electricity, and a Scope 2 number computed by whichever method looks better, both hide the trade they were built to expose [12] [13].
Under-resourcing the interconnection study relative to its actual duration. Median times from request to commercial operation now run past four years industry-wide [4]; a project plan that budgets for the historical two-year median is planning against data that no longer describes the queue it is entering.
Assuming liquid-cooling commissioning expertise scales with facility count rather than commissioning-team experience. Most sites still run no racks above 30 kW [14], which means the commissioning workforce available to a given project has often done this exact acceptance test only a handful of times, independent of how many buildings the developer has completed.
Predictions, with the observations that would falsify them
These are forecasts, separated from the sourced analysis above. Horizon: 15 August 2029.
One. Large-load interconnection agreements will routinely include a standing curtailment or flexibility clause rather than treating flexibility as a one-time negotiating concession, following the shape of PJM’s connect-and-manage proposal. Disconfirmed if the majority of new large-load interconnection agreements in 2029 remain unconditional firm service with no flexibility obligation.
Two. Continuous power-quality monitoring at the point of common coupling, the UPS output, and a sample of rack PDUs will become a standard interconnection requirement for large computational loads, not a site’s voluntary practice. Disconfirmed if dynamic disturbance monitoring remains optional and self-reported for most large loads in 2029.
Three. Facility water temperature classes specified for new liquid-cooled halls will continue trending colder rather than stabilizing, tracking chip heat flux rather than the efficiency incentive to run warm. Disconfirmed if new liquid-cooled builds predominantly specify W40 or warmer by 2029.
Four. Verified, tested shed capability — not enrolled nameplate capacity — will become the figure grid operators actually value and price in demand-response programs serving data centres. Disconfirmed if payment structures in 2029 still key primarily off enrolled capacity with no performance verification requirement.
None of these requires a technology discontinuity. Each follows from pressure already visible in the sourced material above: queues that take years, protection systems already tripped by synchronized load, and a metric-reporting apparatus already being challenged to say what it actually measures.
What to take away
None of the four systems in this guide are delivered once and then trusted forever. An interconnection agreement is a position in a queue that took, on median, more than four years to clear and that most requests never survive [4]. A liquid-cooling loop is a set of acceptance tests — flush, pressure, chemistry, branch flow — that either happened or did not, regardless of how complete the installation looks. Power quality is a property the site did not used to have to manage and now cannot avoid managing, because synchronized accelerator load behaves nothing like the loads existing standards and existing protection were built around. And a demand-response commitment is only as real as the last time it was actually tested end to end.
The throughline is that every one of these gates fails the same way: quietly, under schedule pressure, in the gap between an installation that looks finished and a system that has actually been proven. Commissioning is not the paperwork after the real work is done. For power and cooling on an AI campus, it is the real work.