A number that means less than it looks like
A compression paper’s headline claim has a stable shape: model size cut by half, or three-quarters, or measured in bits per weight instead of bytes, “with negligible accuracy degradation” relative to the uncompressed original. Read enough of these claims and a habit sets in — the claim is treated as answering the question of whether the compressed model still works. It does not. It answers a narrower question: does the compressed model still work on average, across whatever the reported benchmark happened to weight. Those are different claims, and the gap between them is where most of the interesting evidence in this field actually lives.
An aggregate benchmark score is a weighted average over items or tasks:
where
This article works through what independent, methodologically serious evidence about a compressed model actually requires, across three places the same problem recurs: the accuracy claim itself, the latency claim, and the battery and thermal claim. In each, a convenient aggregate or a convenient lab condition stands in for a harder, more specific measurement, and a growing peer-reviewed literature exists specifically to close that gap. It also works through documented cases in which a compression technique’s reported quality retention did not hold up once someone looked past the aggregate.
What perplexity was never built to see
Language-model compression’s original workhorse metric is perplexity: an aggregate, per-token measure of how surprised the model is by held-out text, averaged over an entire corpus. It says nothing directly about whether any specific question was answered correctly, any specific instruction was followed, or any specific fact was retained. It is a fluency measure, not a task measure, and it was never designed to be read as one.
Two of the most consequential post-training quantization methods for large language models made their headline retention claims largely in that frame. GPTQ, using approximate second-order weight information, reported that it “can quantize GPT models with 175 billion parameters in approximately four GPU hours, reducing the bitwidth down to 3 or 4 bits per weight, with negligible accuracy degradation relative to the uncompressed baseline” [8]. AWQ, which protects a small fraction of activation-salient weights from quantization rather than reconstructing against a calibration set, reported that “protecting only 1% salient weights can greatly reduce quantization error” while delivering “more than 3x speedup over the Huggingface FP16 implementation on both desktop and mobile GPUs” [9]. Neither claim is false, and neither paper hid its evaluation protocol; both are careful engineering results, evaluated against the metrics the field had agreed to use. The point is narrower: those metrics were built around aggregate perplexity and a handful of standard multiple-choice suites, which is precisely the frame in which a large task-specific loss can hide behind an unchanged average.
The benchmark that went looking task by task
Jaiswal and colleagues built a benchmark specifically to test whether that hiding actually happens. Their starting premise, stated directly, is that it is unwise to keep relying so heavily on perplexity, “a fairly simple and widely questioned metric,” and their response was LLM-KICK, the Knowledge-Intensive Compressed LLM BenchmarK: a suite covering language understanding, multi-step reasoning, generation, in-context retrieval and in-context summarization, run against the same pruned and quantized checkpoints that had been reported as near-lossless [1]. The results split cleanly by compression family. Pruning methods “suffer significant performance degradation, sometimes at trivial sparsity ratios (e.g., 25-30%)” and largely fail at structured sparsity on knowledge-intensive tasks, a result that sits uncomfortably next to pruning papers whose headline perplexity numbers had looked fine at those same ratios. Quantization methods came through the same audit in noticeably better shape. And the picture was not simply that compression is bad: pruned models, even at sparsity of fifty percent or more, remained robust retrieval systems and held up on text summarization near their dense counterpart’s level. Capability loss under compression is not one dial turning down uniformly. It is a set of separate capacities, some of which a given technique protects and some of which it does not, and an aggregate score cannot tell you which is which.
Li and colleagues ran a complementary audit at larger scale, evaluating post-training quantization across eleven model families from 125 million to 180 billion parameters against five task categories: basic natural-language processing, emergent abilities, trustworthiness, dialogue, and long-context handling, rather than a single aggregate figure [2]. Two of their findings show the same hidden-behind-the-average pattern in a different place. First, tolerance to quantization is uneven even within what looks like one skill: “the tolerance of Multi-Step Reasoning and Self-Calibration abilities to quantization is notably lower than that of the Instruction-Following and In-Context Learning abilities, especially for small LLMs,” meaning a model can keep following instructions while losing its ability to check its own multi-step work, and a benchmark that only samples instruction-following would never see the second failure. Second, context length interacts with the compression method: “long texts (≥4k) are more sensitive to Weight-only and KV Cache Quantization than short texts (<4k),” so a model quantized and validated on short prompts can degrade specifically on the longer inputs a real deployment is more likely to use. Their study also found that weight quantization and key-value cache quantization pushed small models’ willingness to answer sensitive questions in opposite directions, one loosening refusal behaviour and the other tightening it, a behavioural shift no accuracy benchmark is built to register at all.
Matched accuracy is not matched behaviour
A subtler version of the same problem survives even when the audit is genuinely task-specific rather than a single blended score, because “the compressed model scored the same as the baseline on this task” is still an aggregate: an aggregate over the items within that one task. Dutta and colleagues isolated exactly this residual gap. Comparing baseline and compressed models on matched benchmarks, they found that “even when the accuracy of baseline and compressed model are similar, we observe the phenomenon of flips, wherein answers change from correct to incorrect and vice versa,” at a rate that a headline accuracy delta of zero completely conceals; on generative evaluation specifically, the compressed models performed “significantly worse than baseline models” despite matched multiple-choice numbers [7]. A matched score is compatible with a completely different, non-overlapping set of right answers underneath it. For a user comparing today’s response on a familiar question against what the same system told them yesterday, that overlap, not the headline delta, is what they actually experience.
When the claim didn’t survive the next model
The clearest documented case of a compression claim not holding up under independent scrutiny is not a dispute about whether quantization works, but about whether a result generalises across model generations. Huang and colleagues evaluated ten post-training quantization and low-rank adaptation methods across one to eight bits specifically on Llama 3, after those same methods had been widely treated as close to lossless on Llama 2 [5]. Their finding, published in Visual Intelligence, was that Llama 3 “still suffers from non-negligible degradation in linguistic and visual contexts, particularly under ultra-low bit widths”: the same nominal quantization recipe, applied to a newer, more heavily trained model family, produced materially worse results than the prior generation’s numbers had implied it should. A retention claim validated on one model is a claim about that model, not about the technique in the abstract, and treating it as the latter is exactly the error this case study exposes.
A second, more procedural version of the same failure concerns how a quantized model’s calibration set is chosen. Liu and colleagues, building a benchmark specifically for the generalisation ability of quantized models, reported the counterintuitive result that “models quantized using a calibration set with the same distribution as the test data are not necessarily optimal” [11]. That finding matters for how much to trust a retention claim in the first place: a quantization method calibrated on data resembling its own benchmark can report a smaller apparent loss than the same method would show on a genuinely held-out distribution, which means the evaluation protocol itself, not only the compression technique, has to be disclosed and scrutinised before a claim of negligible degradation can be taken as evidence about deployment rather than evidence about that one benchmark.
The gap between a lab number and a device
The same structural problem, a convenient, narrow measurement standing in for a harder one, reappears when the question shifts from whether a model still answers correctly to how fast it really is. A number produced in a simulator, on a development board with no thermal enclosure, or on a single reference handset under laboratory power is not automatically the number a shipped device will produce, and the industry’s own standardisation effort exists because that gap was large enough to be a practical problem rather than a theoretical one. Janapa Reddi and colleagues, building the first cross-vendor mobile inference benchmark together with the SoC vendors, framework providers and model producers who would have to agree to a shared methodology, reported that “within six months, offline throughput improved 3x while latency decreased up to 12x” across the devices and software stacks they tracked [4]. That volatility is the argument for a standardised run rule in one sentence: a latency number with no attached date, device and software stack is not comparable to any other latency number, including a later one for the same model.

Building the instrument that measures the real thing
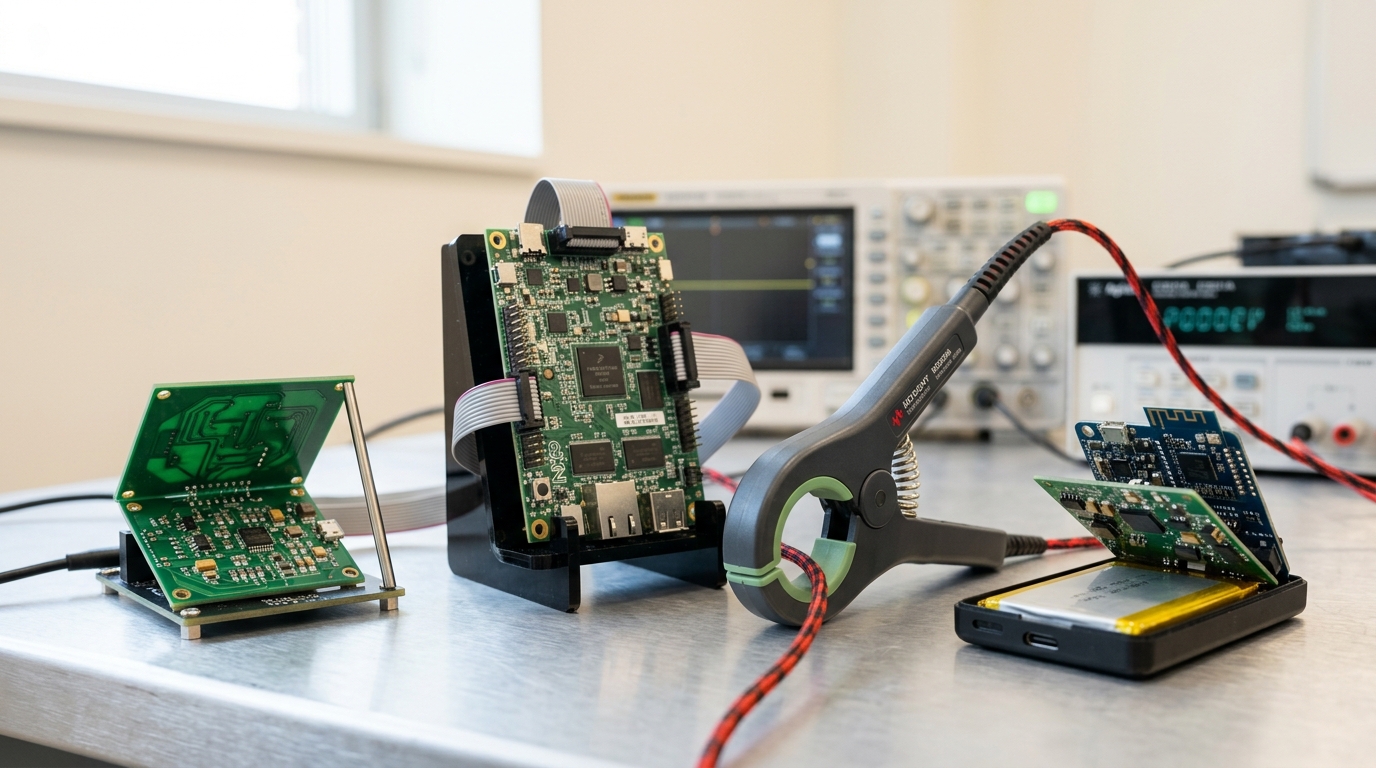
Standardisation solves comparability. It does not by itself solve the deeper problem that a number obtained under one condition, a short run, a cooled bench, a single flagship handset, may simply not be the number a real, continuously used device produces. Laskaridis and colleagues built MELT, infrastructure supporting “headless execution and benchmarking of LLMs on device” across Android, iOS and Nvidia Jetson hardware, precisely because prior reported numbers did not reliably transfer between platforms [3]. Two of their measured results make the simulated-versus-real distinction concrete rather than abstract. Running continuously rather than for a single prompt, they recorded that performance began “dropping with two bumps happening on the 20th and 32nd prompts,” a decline invisible to any benchmark that reports a single warm number rather than a run long enough to reach it. Running on an iPhone 14 Pro, they measured power draw across a session and temperatures “reaching 47.9°C,” a device-skin temperature high enough to change how the phone is usable mid-session, obtained by instrumenting the physical unit rather than by extrapolating from a specification sheet. On the accuracy side of the same infrastructure they reported plainly that “lower bitwidth means higher error rate,” to the point that some models under three billion parameters at three-bit precision were, in their own qualitative evaluation, “unusable… mostly hallucinating or plainly repeating the prompt,” a failure mode a perplexity number would likely understate, and one that a benchmark run once, on one device, for one short prompt, would very plausibly miss entirely.
What a spec sheet doesn’t sustain
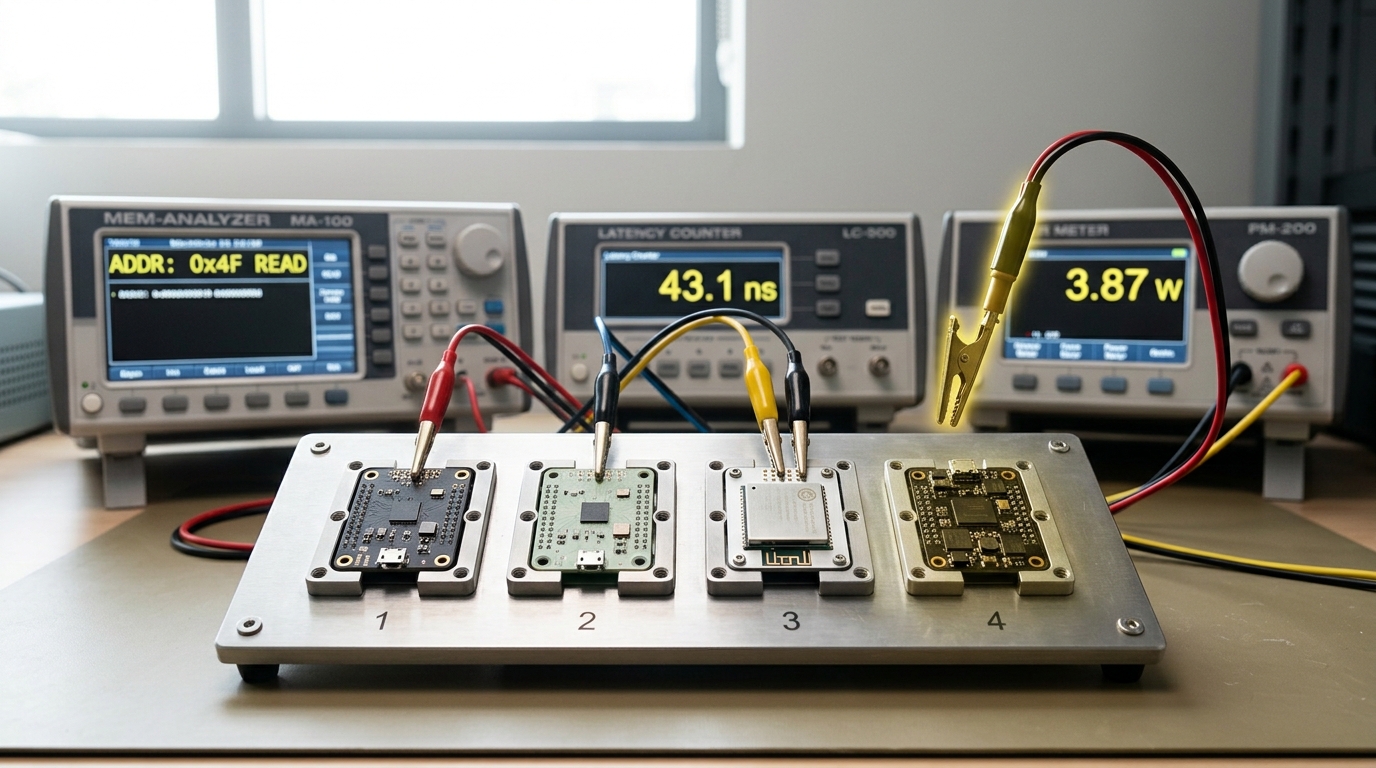
Battery and thermal claims are where the gap between rigorous measurement and marketing language is widest, because the physical instrumentation required to measure them properly, calibrated power sensing, sustained runs, a real thermal load, is exactly the part a vendor announcement is least likely to disclose in full. Bhat and colleagues’ methodology is a useful baseline for what rigorous looks like here: direct experimental characterisation on a commercial handset, reporting that “high performance comes at the expense of larger power density, which leads to higher skin temperatures,” derived from measured power and thermal traces rather than a datasheet figure [10]. Husom and colleagues extended that discipline to compressed models specifically, hardware-profiling twenty-eight quantized language models from the Ollama library running on a Raspberry Pi 4, across energy, accuracy and latency simultaneously [6]. Their measured trade-offs resist a simple story: three- and four-bit quantization cut energy use “by up to 79% compared to FP16,” but the most aggressive settings sometimes cost more energy than a middling one rather than less, a non-monotonic result no single-metric marketing claim would surface. Their accuracy results carry their own warning about aggregation, in a different direction from the rest of this article: on GSM8K mathematical reasoning, “aggressive quantization does not significantly degrade performance,” but only because accuracy averaged roughly six percent across every model and bit-width tested. The task was already near its floor before any weight was touched, so an unchanged score there is not evidence that the capability survived compression; it is evidence that the capability was barely present to begin with.
Set that kind of study against a representative vendor disclosure. Meta’s announcement of its quantized Llama models reports “an average reduction of 56% in model size,” a “41% average reduction in memory usage,” and “2-4x speedup,” measured, by its own account, “based on testing with Android OnePlus 12” and briefly on two other Samsung handsets [12]. Those figures are not fabricated, and the post is transparent that they come from one or a few specific devices rather than a claimed general truth. But set next to Husom’s twenty-eight-model, multi-metric, hardware-profiled comparison, or Bhat’s directly measured thermal traces, the difference in evidentiary weight is the difference this whole section is about: a single-condition, single-device figure published to support a product claim is not the same kind of evidence as a study designed, from the outset, to expose where a compression technique’s advantages break down.
What a defensible retention claim actually requires
Collecting the failures above into a standard, a claim that a compressed model still works needs at least four things the aggregate version routinely omits.
A task-specific breakdown, not only an aggregate. LLM-KICK and the five-category quantization study both exist because a single blended score cannot distinguish uniform, mild loss from severe, concentrated loss landing on one capability [1, 2]. Multi-step reasoning, long-context handling and refusal behaviour need to be checked individually, not inferred from a general-knowledge multiple-choice average.
A same-item comparison, not only a matched score. Flip rate, how many individual answers actually changed, in either direction, between the baseline and the compressed model, carries information a matched accuracy figure destroys by construction [7].
Cross-generation and cross-protocol replication, not a single validated checkpoint. A retention result measured on one model family, or with one calibration-set choice, is evidence about that configuration; Llama 3’s degradation relative to Llama 2 under nominally the same recipe, and the documented sensitivity of results to calibration-set distribution, both show that a result does not automatically travel [5, 11].
Measurement on the physical device, under sustained load, not a simulated or single-shot number. MLPerf Mobile’s own cross-device volatility, and MELT’s discovery of performance drops only visible after twenty or more consecutive prompts, both show that a number obtained once, briefly, or in simulation is a different quantity from the one a continuously used device actually produces [4, 3].
Where researchers disagree, and they do, genuinely, not just in emphasis, is over how much task-specific evidence is enough before a compression technique should be called safe for general deployment. The quantization literature that reports negligible perplexity or aggregate-accuracy loss at four bits is not wrong about what it measured; the task-specific and behavioural literature that finds real degradation at the same bit-width under the same nominal method is not wrong either. Both measured real things. The disagreement is about which of those measurements should govern a shipping decision, and it will not be resolved by more perplexity numbers.
Predictions, with the observations that would falsify them
These are forecasts, separated from the sourced findings above, offered on the assumption that no new single aggregate metric emerges to replace perplexity as a universally trusted proxy. Horizon: 15 August 2028.
One. Compression papers at major venues will increasingly be expected to report task-stratified results and flip rates alongside an aggregate score, rather than the aggregate alone, because the aggregate-only pattern has now been directly and repeatedly shown to hide material loss. Disconfirmed if leading 2028 compression papers at top venues still report a single blended accuracy or perplexity figure as their primary evidence with no task or item-level breakdown.
Two. On-device latency and energy claims in vendor announcements will increasingly cite a sustained-load figure alongside a first-response one, following the pattern MELT and comparable measurement studies have established. Disconfirmed if 2028 vendor disclosures for on-device models still report only a single short-run or first-token figure with no sustained-duration measurement.
Three. Independent audits that re-test a compression technique on a newer model generation, following the Llama 3 case, will become a standard check before a technique is trusted across a model family rather than a single checkpoint. Disconfirmed if by 2028 the field still treats a quantization method’s validation on one generation as sufficient evidence for the next without re-measurement.
Four. The gap between the most rigorous independent measurement studies and vendor marketing disclosures will narrow only where regulation or procurement standards require it, not through voluntary disclosure. Disconfirmed if 2028 vendor claims about compressed on-device models routinely match the multi-device, multi-metric, sustained-load rigor of the current peer-reviewed measurement literature without any external requirement driving it.
What to take away
A compressed model that still works is a claim built out of at least three separable measurements: whether every capability the deployment actually needs survived, not just the average one; whether the latency and energy numbers were taken from the real device under a real sustained load rather than a simulator or a single short run; and whether the specific retention result travels to the model, hardware and calibration protocol actually being shipped, rather than the one it was originally measured on. Aggregate perplexity, a single benchmark-average accuracy figure, and a one-device marketing claim can each be true and still leave every one of those three questions unanswered. The audits that have gone looking task by task, device by device and generation by generation keep finding real degradation sitting underneath numbers that looked fine, not because the original claims were dishonest, but because an aggregate is built, by its very arithmetic, to let a large specific loss hide behind an unchanged average. Asking which specific capability, on which specific hardware, under which specific sustained condition, is not scepticism for its own sake. It is the only form the question “does it still work” can take that an aggregate number cannot quietly answer yes to by accident.