
“Reshoring” Is Being Asked to Cover Two Migrations That Are Not the Same Migration
Every few months, a headline announces that semiconductor manufacturing is “diversifying” or “reshoring” — a new fab breaking ground in Arizona, a new subsidy round in Brussels, a new production line in Gujarat — and the implicit picture is a single map slowly redistributing itself away from its old concentrations. That picture is wrong, not because the individual facts are false, but because it silently merges two manufacturing geographies that behave nothing alike, are moving in opposite directions, and are not even on the same clock.
At the leading edge — the ≤3-nanometer-class logic that goes into the newest AI accelerators and phones — capacity is, very slowly, starting to leave Taiwan. At the trailing edge — the 28-nanometer-and-older logic that runs power supplies, automotive electronics, and most of the world’s actual chip volume — capacity has been pouring into China for six consecutive years, is reflected in real price and utilization data today, and shows no sign of decelerating. One of these is a funding announcement with a 2030 target date. The other is an already-realized fact with a six-year paper trail. Calling both of them “reshoring” is like describing a marathon’s first mile and its finish line with the same word because they are both, technically, part of the same race.
This article separates the two geographies, states what is actually known about each one’s trajectory with the sourcing shown, computes the gap between them as a single number, and takes seriously the strongest published objection to the whole framing — a Center for Strategic and International Studies argument that “overcapacity” is the wrong lens for China’s mature-node buildout entirely. That objection turns out to be right about something and wrong about something else, and the difference matters for what a reader should actually conclude.
This is also, deliberately, a narrower object than the “bifurcation” other coverage of this industry already discusses. A separate strand of analysis tracks how China’s design and export-control ecosystem — SMIC’s node roadmap, Huawei’s Ascend accelerators, DUV-based workarounds for EUV export bans — is diverging from the West’s on a multi-year forward horizon, and lays out three explicit, labeled scenarios for where that ecosystem-level split goes next. That is a real and separate question, built from a different evidentiary base (design capability and export-control mechanics) and pointed at a different time horizon (2026-2031, forward-looking). The bifurcation measured here is backward-looking and confined to one thing: where physical manufacturing capacity, at two specific process tiers, has already sat and is documented to be moving, from 2020 to the present. A reader interested in the broader ecosystem question should treat this article as a component of that larger picture, not a restatement of it.
China’s Mature-Node Share Has Been Climbing for Six Years, and the Trend Has Its Own Paper Trail
Start with the trend that is not a projection. The Congressional Research Service’s own account of the U.S. Section 301 investigation into Chinese semiconductor policy states that China’s share of the 28-to-65-nanometer chip market rose from 18 percent in 2020 to 31.5 percent in 2023 — a 13.5-percentage-point gain in three years — built in part on more than $150 billion in Chinese state funding, and that mature-node chips of this kind account for roughly 88 percent of global chip sales by volume, though only about 40 percent by value [1]. By the time of that report’s most recent figures, China’s mature-node position is described simply as producing “a third” of the world’s supply in this segment — consistent with the 2023 figure continuing to climb rather than plateauing.
A separately sourced and differently scoped estimate puts China’s share of global mature-node capacity at roughly 28 percent by the end of 2025, projected to reach 39 percent by 2027 [2]. That figure does not sit on the same continuous series as the CRS numbers — it is scoped to a broader “28-nanometer-and-up” capacity measure rather than the CRS’s bounded 28-to-65-nanometer market-share figure, which is exactly the kind of node-boundary discrepancy that makes single point-in-time comparisons across sources unreliable even when both are honestly reported. What both agree on, independently, is the direction and the rough decade-scale magnitude: a rise from below one-fifth of the segment in 2020 to somewhere in the low-to-high thirties by 2026-2027, with continued Chinese fab construction still adding to that base rather than leveling it off [2].
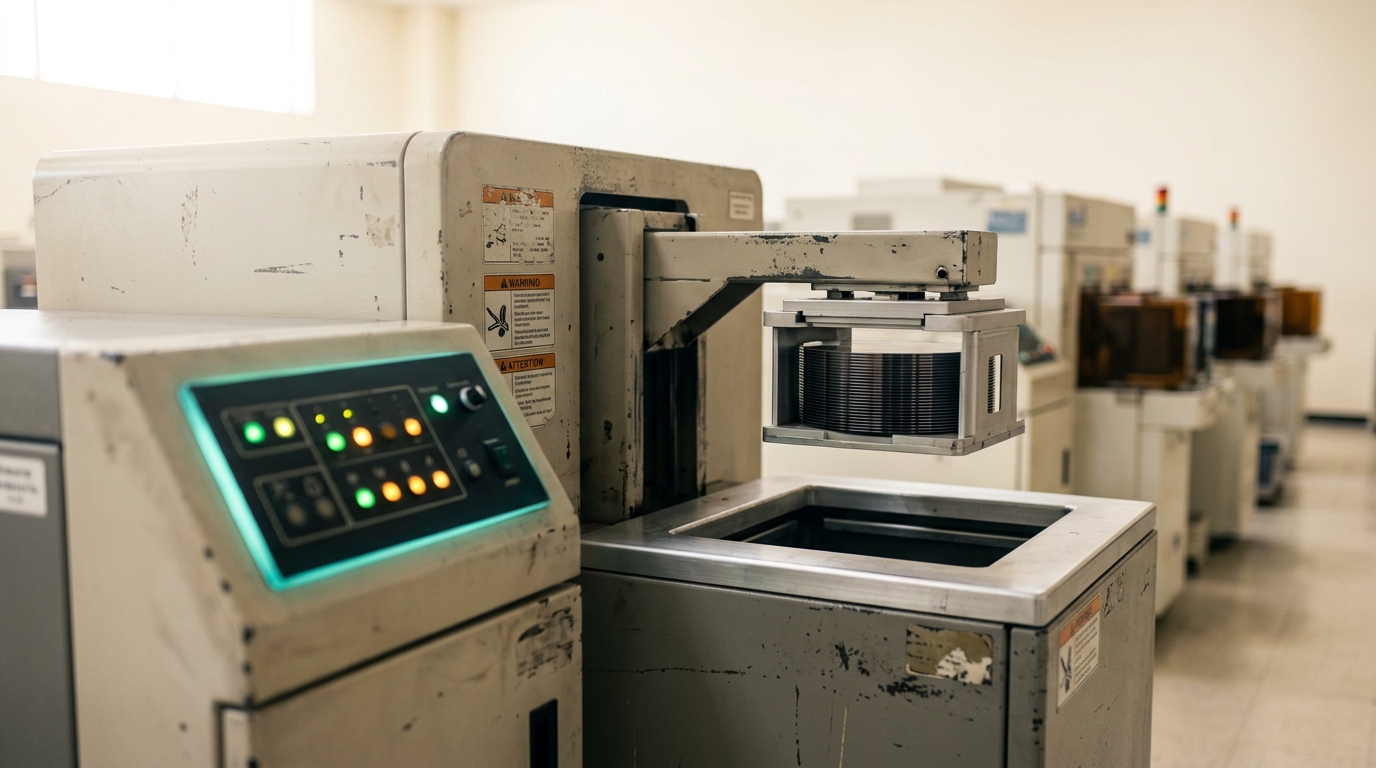
This is not an abstraction sitting in a market-share spreadsheet. It shows up in prices and in factory utilization, which is what makes it an observed trend rather than a modeled one. EE Times reported that mature-node foundry utilization across the industry had dropped to roughly 70 percent in 2024, with average selling prices down about 5 percent that year and operating profit in the segment down 23 percent from 2023 — a genuine trough, driven partly by inventory built up during the pandemic-era chip shortage and partly by Chinese capacity absorbing demand that used to go elsewhere [4]. By 2026, TrendForce was reporting the opposite problem: average utilization across the top ten global foundries’ 8-inch fabs recovering to around 88 percent, projected toward 90 percent in the second half of the year, driven by AI-adjacent demand for power-management chips — and mature-node foundries moving to raise prices, with increases of up to 10 percent or more reported starting in the second quarter, the first sustained mature-node price increase after roughly two years of decline [3]. A trough followed by a recovery is not, by itself, evidence that Chinese capacity growth has stopped mattering — it is evidence that the mature-node segment has a real supply-and-demand cycle that Chinese entry has been shaping, hard enough to swing industry-wide utilization by nearly twenty percentage points and prices by double digits in either direction inside two years.
One more fact belongs in this section, because it complicates the story in a useful way rather than a convenient one. China’s own “Big Fund” — the state semiconductor investment vehicle that financed much of the 2020-2023 mature-node buildout across its first two rounds, totaling roughly $51 billion — appears to be changing its own strategy. Its newest phase, established in 2024 at roughly $47.5 billion, is being redirected away from new fab construction and toward advanced packaging, semiconductor equipment, and AI-chip development [10]. Beijing’s own capital allocation, in other words, is not treating “build more mature-node wafer capacity” as the next problem to solve — which is either evidence that the state considers the existing capacity buildout largely complete, or evidence that even China’s own planners are wary of adding further to a segment already showing overcapacity symptoms. Either reading is consistent with a rising share; neither one reverses it.
The Big Fund’s own history makes the scale of the reversal in strategy legible. Its first round, deployed starting in 2014, raised roughly $21.8 billion; its second, in 2019, roughly $29.1 billion; its third and largest, established in May 2024, roughly $47.5 billion — a trajectory of consistently larger commitments across three rounds totaling close to $98 billion, the bulk of which financed exactly the wafer-fab construction this section has been tracking [10]. That the newest and biggest round is the one being redirected away from fabs specifically, toward packaging, equipment, and AI-chip design instead, is not a minor footnote. It is the clearest available signal of how Beijing itself currently reads the state of its own mature-node capacity: not as a gap still needing to be filled with more wafer starts, but as a base now large enough that the next dollar is better spent one tier downstream.
It is also worth being explicit that China is not the only country adding trailing-edge capacity, and that framing this as a two-country story would understate how distributed the segment still is. Older-generation 200-millimeter and mature 300-millimeter lines continue running in the United States, Europe, and Japan, several of them at foundries that made a deliberate strategic choice years ago to stop competing at the process frontier and specialize in exactly this tier instead — GlobalFoundries and UMC are the clearest examples, and neither is contracting. What distinguishes China’s trajectory from theirs is not that it is the only mature-node geography, but that it is the only one whose share of the global total is demonstrably rising rather than holding roughly steady, which is the specific claim this section’s numbers support and the specific claim a reader should take from it.
The Leading Edge’s “De-Concentration” Has Not Started Yet, By the Same Standard
Now hold the same magnifying glass up to the other pole. The Semiconductor Industry Association, working with the Boston Consulting Group, projects that the United States’ share of total global semiconductor fab capacity — not leading-edge specifically, all of it — will rise from roughly 10 percent today to 14 percent by 2032, after falling from 37 percent in 1990 to roughly 12 percent in 2020 and 10 percent in 2022 [7]. That is a real, multi-decade reversal in direction, and it is the number most often cited as evidence that leading-edge manufacturing is “coming home.” But it measures the wrong thing for this comparison: it blends legacy US fabs making trailing-edge analog and automotive chips with the tiny sliver of genuinely leading-edge capacity now under construction, and a 4-percentage-point total-capacity gain over a decade tells a reader almost nothing about what is happening specifically at the process nodes that matter for AI accelerators.
The more precise numbers are more revealing, and they point the same direction as the vague one, only further. For sub-2-nanometer-class capacity specifically — the segment that actually defines “leading edge” going forward — reporting tied to the same SIA/BCG analysis projects a roughly 70 percent Taiwan / 30 percent United States split by 2030 [8]. A separately sourced Taiwanese industry-research estimate, cited independently, projects the United States capturing roughly 28 percent of leading-edge (sub-10-nanometer) manufacturing by 2032, while affirming that TSMC itself keeps the overall foundry lead through at least that year [9]. Two independent estimates, using different methodologies and different node cutoffs, converge on the same rough figure: roughly a quarter to a third of leading-edge capacity in US hands, eight to ten years from now.
Here is what neither number changes: as of today, in 2026, the United States has essentially none of it, by the node-boundary standard this cohort’s own concentration work uses elsewhere — a node counts once a named source reports it in volume production, not risk production or a construction milestone. TSMC’s Arizona Fab21 Phase 1 is in 4-nanometer volume production, which is real, current, and shipping — but it sits one and a half node generations behind the ≤3-nanometer-class threshold that defines “leading edge” for this comparison. TSMC’s second Arizona fab is now targeted for 3-nanometer mass production in the second half of 2027, with capacity across all four Arizona fabs reported as already reserved by customers — real demand, real commitments, with major US customers including Apple, Nvidia, AMD, and Qualcomm separately reported to be factoring geopolitical considerations into where they place orders — but still, as of this writing, zero wafers at the node that would actually count [8]. The 28-to-30-percent figures above are not measurements. They are the stated assumption behind a projection, built on the premise that a specific set of announced fabs clears construction, tooling, and qualification on the schedule currently guided — the same kind of schedule that, across this industry’s recent record, slips more often than it holds.
One more honest limit belongs here. A “Taiwan 70 / US 30” split for sub-2-nanometer capacity by 2030 is a two-country framing of an industry that has at least one other genuine leading-edge player: Samsung Foundry, in South Korea, which has its own 2-nanometer-class roadmap and its own customer commitments. Neither the SIA/BCG-linked figure nor the independent Taiwanese estimate cited above appears to allocate a separate share to Korea, which means the “30 percent” attributed to the United States is either a rounding simplification that quietly folds Korea’s small remaining share into “everyone but Taiwan,” or a genuine claim that Korea’s leading-edge share becomes negligible by 2030 — and the sourcing reviewed for this article does not resolve which. That is a real gap in the numbers this comparison rests on, not a rhetorical hedge, and it should be read as a reason to treat “30 percent” as an order-of-magnitude claim about the scale of US entry rather than a precise figure.

Two Clocks, Placed on the Same Page
Put the two trajectories in one table, using only the figures established above, and the asymmetry stops being a matter of interpretation.
| Year | China’s share of global mature-node capacity | United States’ share of global ≤3nm-class leading-edge capacity |
|---|---|---|
| 2020 | 18% (observed) [1] | 0% — no country outside Taiwan/Korea had ≤3nm-class capacity |
| 2023 | 31.5% (observed) [1] | 0% — unchanged |
| 2025-2026 | ~28-33%, depending on source scope (observed) [1, 2] | 0% — Arizona’s live production is 4nm, one node generation short of this bracket |
| 2027 | ~39% (projected, TrendForce) [2] | still 0% under this node rule; first ≤3nm-class US output not targeted before 2H27 [8] |
| 2030 | not separately projected past 2027 in sourcing reviewed here | ~30% (projected, sub-2nm-class) [8] |
| 2032 | not separately projected in sourcing reviewed here | ~28% of leading-edge overall (projected, independent estimate) [9] |
Define a bifurcation gap, for any window, as the realized percentage-point change in China’s mature-node share minus the realized percentage-point change in the United States’ leading-edge share over the same window. For 2020 to 2026 — the only window in which both sides of the comparison can be computed from observed rather than projected figures — the mature-node side moved by roughly 10 to 15 percentage points, depending on which source’s scope is used, while the leading-edge side moved by exactly zero, because the category the United States is meant to be gaining share in did not exist inside its borders at any point in that window. The realized bifurcation gap for 2020-2026 is not a small number in China’s favor. It is the entire gap, because only one side of the ledger has any observed entries at all.

The forward-looking picture, 2026 to 2030, is more genuinely two-sided — if the announced pledges hold. Projected forward, mature-node consolidation continues at roughly the same pace it has already shown (the 28-to-39-percent, one- to two-year move already reported), while leading-edge de-concentration is projected to move from zero to roughly 30 percent inside four years, an even faster percentage-point-per-year rate if it happens on schedule. That comparison is worth taking seriously rather than dismissing, but it rests on a premise the mature-node trend does not need: that a specific list of subsidized fabs — TSMC’s second and further Arizona lines chief among them — reaches qualified, high-volume ≤3-nanometer-class production broadly on the timeline currently guided, rather than slipping the way leading-edge construction milestones in this industry very often do. The trailing-edge trend requires no such assumption; it is describing wafers already shipped, priced, and counted in utilization statistics going back to 2020. The leading-edge trend is describing a subsidy pledge’s best case. Treating the two as symmetric because their projected 2030 magnitudes happen to look similar mistakes a completed six-year fact for an unstarted four-year promise.
One limit keeps this comparison honest rather than merely rhetorical. The bifurcation gap defined here is not a single shared index the way a true country-capacity concentration index would be — it sets a rate of change inside the mature-node segment specifically against a rate of change inside the ≤3-nanometer-class segment specifically, two different slices of the industry rather than two shares of one common total. Building a fully unified index, across all five relevant countries and every node band at once, is exactly the harder, paper-grade project this series’ own quantitative work is separately built to carry; this article’s coefficient is deliberately the simpler, essay-grade version of that comparison, built from directly cited shares rather than a reconstructed index. That is a real constraint on what the coefficient can claim to measure, but it is not the constraint that actually drives the verdict above. The gap this article documents is not, at bottom, a difference in what is being counted. It is a difference in what kind of fact each number is: one column reports something that has already happened, on a public record stretching back six years; the other reports something a specific, named set of companies has committed capital toward and not yet delivered. No amount of index-building resolves that asymmetry, because it is not an artifact of the arithmetic. It is the finding.
This article’s claim also has a stated failure condition, worth naming rather than leaving implicit: if China’s mature-node share is reported flattening or falling in the next full data cycle — plausible, given the Big Fund’s own pivot away from new fab construction — while US leading-edge share continues climbing toward its projected 2030 range, the “opposite directions” framing weakens into a single leading-edge-only story, and a future update to this comparison would need to say so plainly rather than preserve the more dramatic verdict by omission.
The Best Objection: China Says There Is No “Overcapacity” to Consolidate
The most serious published challenge to this entire framing does not dispute the 18-to-31.5-percent trajectory, or the 88-percent-of-volume figure, or any of the numbers above. It disputes what they are supposed to mean. CSIS’s “Legacy Chip Overcapacity in China: Myth and Reality” argues directly that “there is no single market for ‘legacy semiconductors,’ as there is for products like EVs and PVs” — foundries build to customer-specified designs under contracted production levels tied to actual demand, not to a single fungible commodity that can be simply “overproduced” the way steel or solar panels can [5]. The piece further argues that by 2030, China’s domestic mature-node capacity will be able to cover only around 90 percent of its own domestic demand, up from roughly 37 percent in 2020 — meaning a large share of the buildout is import substitution, not export dumping — and that “some in the industry hold that an optimal level of overproduction is around 15-20 percent,” treating a meaningful capacity buffer as a normal feature of foundry economics rather than evidence of a state-engineered glut [5]. A later, independent CSIS analysis by Andreas Schumacher reaches a related conclusion from different evidence, citing Bernstein Research’s estimate that China would need roughly four more years at 2023-level spending just to fully meet its own mature-logic needs, and states plainly that no expert consensus on the threat of overcapacity had emerged even after a full cycle of competing think-tank analyses [6].
This is a real objection, not a talking point, and it deserves to be stated as strongly as its authors intended it: if China’s mature-node buildout is substantially aimed at import substitution rather than export flooding, and if a 15-to-20-percent buffer is industry-normal rather than a warning sign, then describing the trend as “consolidation” carries an implication — a deliberate, threatening concentration of supply — that the underlying economics do not support. A share number rising because a country is replacing imports with domestic production is a genuinely different fact from the same share number rising because a country is capturing external markets through subsidized underpricing, even though both produce an identical-looking line on a chart.

What the Objection Actually Changes, and What It Does Not
Here is where the CSIS argument has to be engaged specifically rather than cited once and set aside, because it changes less than it first appears to. CSIS disputes the interpretation of China’s rising mature-node share — whether “overcapacity” and its implied threat is the right frame for it. It does not dispute the share figure itself. Eighteen percent in 2020 and 31.5 percent in 2023 stand regardless of whether the resulting capacity is aimed at Chinese factories or European ones; the 90-percent-domestic-coverage-by-2030 claim, if anything, requires the underlying capacity growth to continue at something like its current pace, since it is describing what that growth is for, not arguing that it is smaller than reported. A buildout that is 90 percent aimed at import substitution is still a buildout that moves the global share number, and a global share number moving from under one-fifth to nearly a third of a market representing 88 percent of world chip volume is still a geographic concentration shift worth tracking on its own terms — it is simply a shift whose motive is more defensive than the “flooding the world with cheap chips” framing implies.
That distinction matters for exactly one thing this article set out to measure, and it is worth being precise about which thing. It does not change the direction or rough magnitude of the trailing-edge trend, and it does not touch the leading-edge side of the comparison at all — CSIS’s argument is scoped entirely to whether China’s own capacity growth constitutes a predatory glut, which has no bearing on whether or how fast US leading-edge capacity is separately coming online. What it changes is the verdict a reader should attach to the trailing-edge line on the chart above: not “a hostile actor is flooding a market,” which the CSIS analysis makes a real case against, but “a country’s domestic manufacturing footprint at one tier of the industry is growing for reasons that include, but are not limited to, external competition” — a more boring, more accurate, and no less consequential description of exactly the same rising percentage. The bifurcation this article measures survives the objection intact; the moral color the word “consolidation” implies does not, entirely, and should be read with that qualification attached every time the trend is cited going forward.
What “Reshoring” Would Have to Mean to Honestly Cover Both Maps
None of this requires believing that either trend will hold exactly on its stated schedule. Chinese mature-node fabs could slow construction if the current price recovery proves temporary; Big Fund Phase III’s own pivot away from new fab-building suggests Beijing may already be hedging that possibility. US leading-edge capacity could arrive faster than the 2030 projections suggest if TSMC’s Arizona schedule keeps beating its own guidance the way its second fab’s timeline already has, or slower if it does not. Both are genuinely open questions, and a serious reader should hold the 2030 and 2032 projections above as exactly that — projections, not facts, clearly labeled as resting on pledges rather than production logs.
But the asymmetry this article opened with is not a projection, and it will not un-happen no matter how either forecast resolves. For six years, one geography’s share of one tier of this industry has been rising, and the evidence for that rise sits in trade statistics, utilization rates, and prices that have already moved. For the whole of that same period, the other geography’s projected gain in the other tier has been exactly nothing, because the technology it is supposed to be gaining share in has not yet existed inside its borders at any point along the way. A word like “reshoring” that is meant to describe both of these things at once needs to do more than gesture at a single arrow on a single map. It needs to say, every time it is used, which clock it is describing — the one that has been running since 2020, or the one whose first tick is still scheduled for some year after this one.