Two axes, one constraint
Every energy-storage device can be placed on a chart with two axes: how much energy it holds per unit mass — specific energy, in watt-hours per kilogram — against how fast it can push that energy out, specific power, in watts per kilogram. Both axes run logarithmic, because the technologies worth comparing span roughly four orders of magnitude on each. The chart is called a Ragone plot, after David V. Ragone, who introduced it in a 1968 SAE technical paper written to help engineers evaluate battery systems for electric vehicles — a problem in which range and acceleration are set by the same pack and pull in opposite directions [1]. Ragone’s original diagram drew lead-acid, nickel-cadmium, silver-zinc, sodium-sulfur and several other chemistries of the day as curved bands rather than single points, because a real cell’s deliverable energy falls as the power drawn from it rises [2]. That falling curve is the whole plot’s argument in one shape, and it has held for every technology added to the chart since — capacitors, supercapacitors, flywheels, and every lithium-ion cell built from 1991 onward.
A 2023 systematic review counted roughly three hundred publications using the phrase “Ragone plot” in their title, abstract or keywords, and found the chart applied not only to batteries but to compressed-air storage, superconducting magnets, flywheels, fuel cells, and even desalination processes — a sign of how far the framework has travelled from Ragone’s original electric-vehicle brief [2]. The diagonal lines often drawn across a Ragone plot are isochrones: every point along one line can deliver its rated power for the same discharge duration, so a device’s position relative to those lines states, directly, whether it behaves more like a fuel tank or more like a discharging spark [10]. Read that way, the chart has a genuinely empty region: the upper right, where specific energy and specific power are both high. Nothing sits there. The interesting question for any claimed advance in storage is not whether it improved on some earlier number, but whether it moved toward that empty corner — or simply relocated along the curve that was already there.
Why the trade-off is physical, not incidental
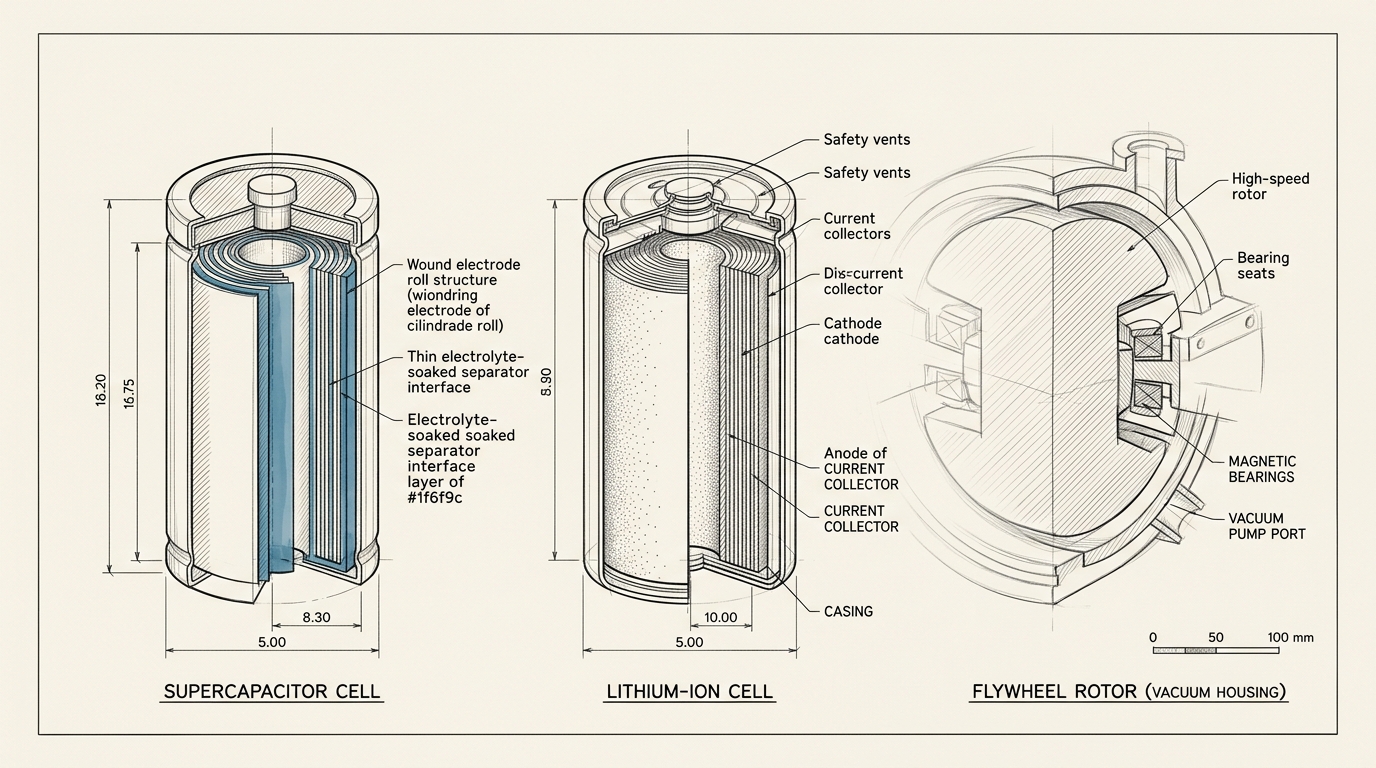
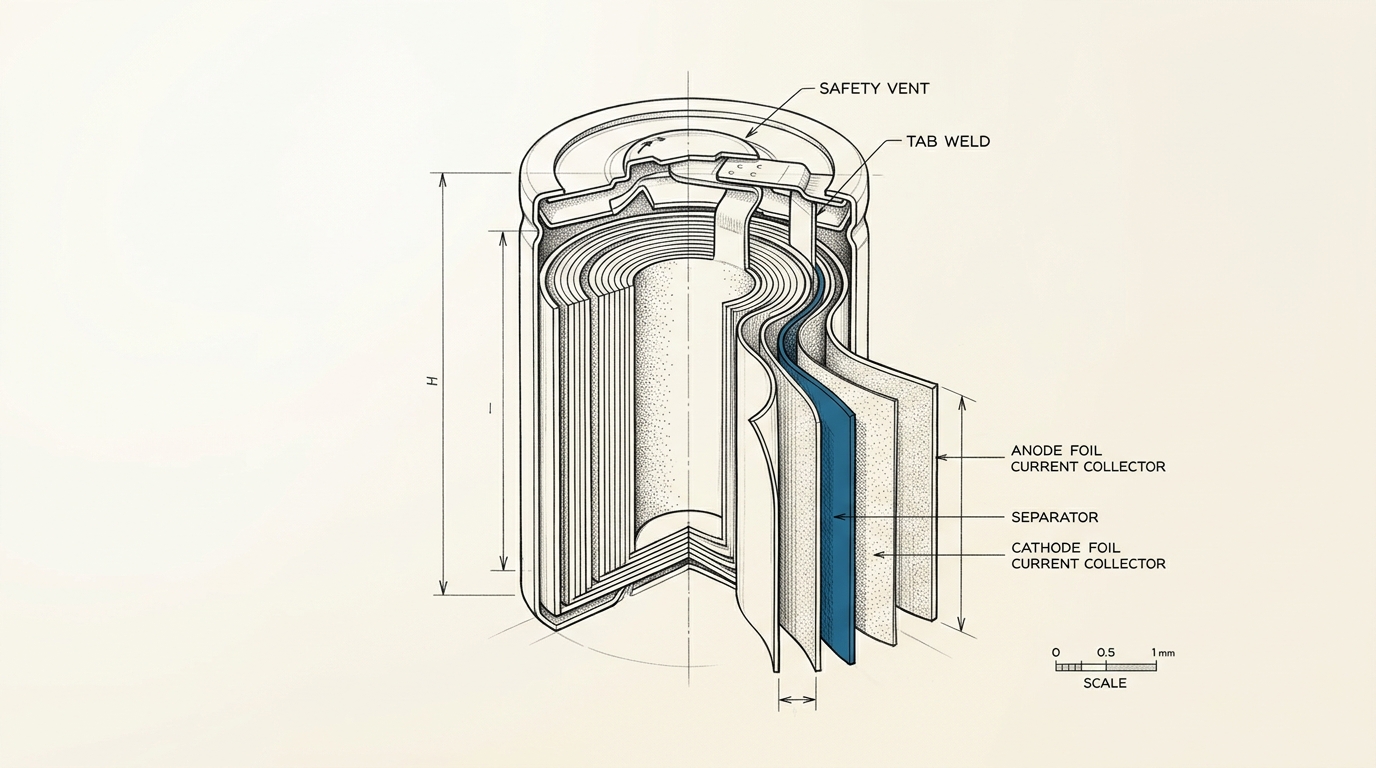
The reason the upper right stays empty is not a failure of engineering effort; it is built into where each quantity comes from. Specific energy scales with the volume of active material a device carries — more lithium compound, more lead dioxide, more spinning mass, more energy. Specific power scales with surface area and internal resistance — how quickly ions can cross an interface, how little the material impedes current on the way out. Thickening an electrode to pack in more active material also lengthens the diffusion path ions must travel and raises the cell’s internal resistance, which caps how fast it can be discharged without a large voltage drop; thinning it back down restores power at the direct cost of the energy that thickness bought [7, 2]. The same logic holds outside electrochemistry: a supercapacitor stores charge electrostatically at an electrode-electrolyte interface rather than in a bulk reaction, so it can charge and discharge in seconds, but that interface can only hold so much charge per unit mass [3]. A flywheel stores energy as bulk kinetic energy in a spinning mass, set by moment of inertia and the square of angular speed, while its power is limited by an entirely separate machine — the motor-generator and bearings bolted onto it [4]. In every family, the geometry that maximises one quantity penalises the other, because the two quantities are drawn from different physical sources inside the same device.
The families, with numbers
The table below gives representative specific energy and specific power ranges for the main storage families, stating whether each figure is a cell-level or system-level measurement and naming the source. Figures vary with manufacturer, state of charge and discharge rate, so these are ranges, not single precise values.
| Family | Specific energy (Wh/kg) | Specific power (W/kg) | Level | Source |
|---|---|---|---|---|
| Supercapacitor (commercial module) | ~4.5 | ~2,000 | System/module | [3] |
| Flywheel, vehicular prototypes | 3.5–6.4 | 3,150–5,500 | Rotor/system | [4] |
| Lead-acid, stationary/grid | 35–40 | ~250 | System | [5] |
| Li-ion, energy-optimised (grid) | 150–180 | ~800 | System | [5] |
| Li-ion, power-optimised (26650 LFP cell) | ~108 | ~3,300 (10 s pulse ~5,600) | Cell | [6] |
| Gasoline (chemical fuel, LHV) | ~12,200–12,700 | not intrinsic to the fuel | Fuel | [9] |
Supercapacitors sit at the plot’s high-power, low-energy end. A commercial ultracapacitor module assessed for grid use delivers roughly 4.5 Wh/kg but can sustain around 2,000 W/kg, meaning it empties in single-digit seconds at its rated power rather than hours [3]. Flywheels occupy similar territory by a different mechanism: vehicular prototypes reviewed in 2015 delivered 3.15–5.5 kW/kg with only 3.5–6.4 Wh/kg of usable energy, though the same review notes a purpose-built energy flywheel rotor reaching roughly 195 Wh/kg — comparable to a lithium-ion cell — which shows that even within one flywheel design space, energy and power are a choice, not a fixed property of “flywheels” as a category [4]. Lead-acid, the oldest rechargeable chemistry still in production, sits further up the energy axis and down the power axis: 35–40 Wh/kg and roughly 250 W/kg in stationary service, per a 2018 review of lead battery technology for utility storage [5].
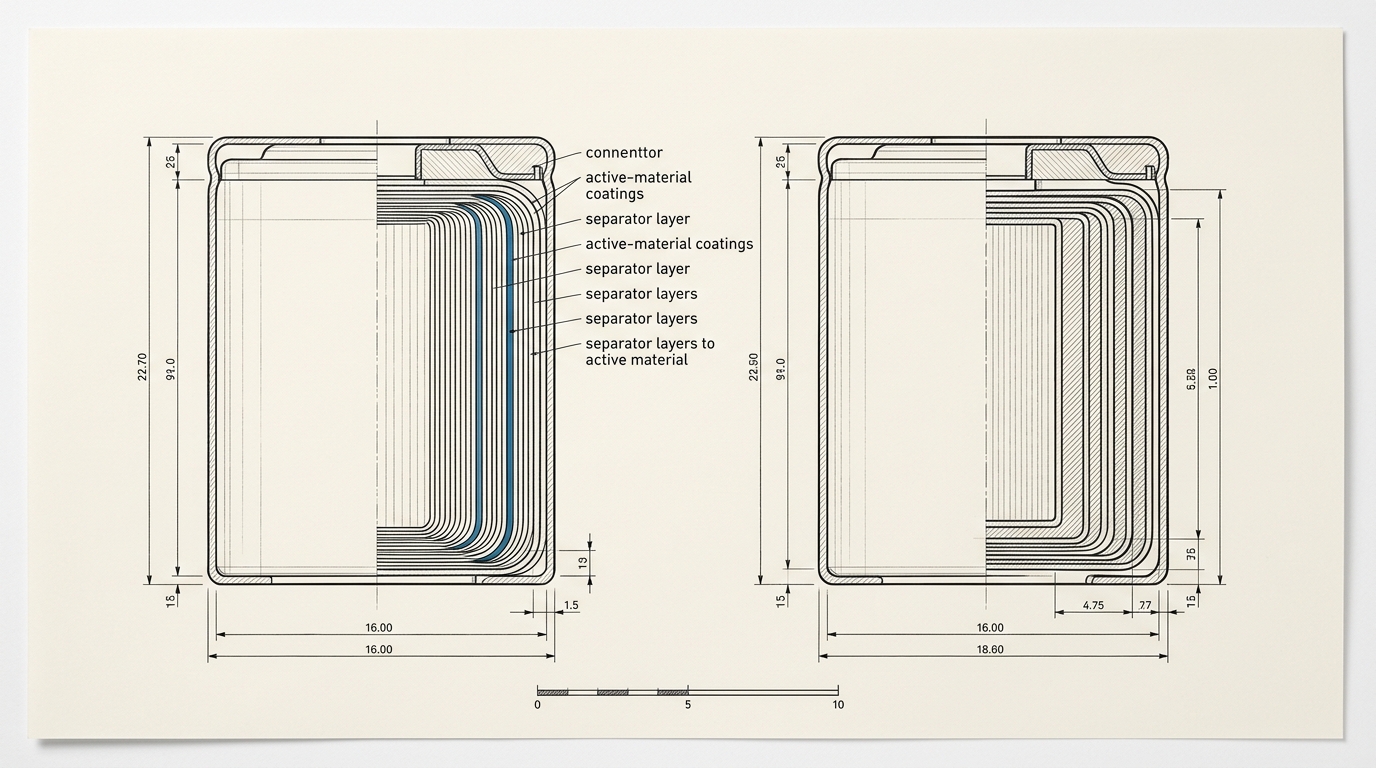
Lithium-ion is the clearest case of the trade-off as a design choice rather than a chemistry property, because both ends of the curve are built from the same active materials. A grid-oriented, energy-optimised lithium-ion system reaches 150–180 Wh/kg but only about 800 W/kg [5]. A123 Systems’ ANR26650M1, a cylindrical cell explicitly marketed as “high power,” rates a 70-gram cell at 2.3 Ah and 3.3 V nominal with a 70 A continuous and 120 A ten-second pulse discharge rating — arithmetic that works out to roughly 108 Wh/kg of specific energy against roughly 3,300 W/kg continuous and 5,600 W/kg pulsed specific power [6]. Tear-down studies of commercial cells attribute the difference to electrode architecture: power cells use thinner active-material coatings, smaller particles and higher-porosity electrodes, which shorten the ion diffusion path and lower internal resistance at the direct cost of the packed-in capacity that thicker coatings would provide. Sandia National Laboratories’ 1997 characterisation of early commercial lithium-ion cells — explicitly framed as Ragone-plot work — found a roughly 100 Wh/kg baseline and traced power differences between cell designs directly to measured impedance, confirming the mechanism was already visible in the technology’s first commercial decade [7].

Fuel, off the chart entirely
Gasoline belongs on the same axes only awkwardly, and that awkwardness is itself informative. Compiled measurements of gasoline’s lower heating value cluster between about 44 and 45.7 MJ/kg — roughly 12,200 to 12,700 Wh/kg — which dwarfs every electrochemical cell in the table above by two orders of magnitude [9]. The U.S. Department of Energy’s own fuel properties comparison lists gasoline’s energy content at 112,000–116,090 Btu per gallon, alongside a directly comparable figure for hydrogen of 33.3 kWh/kg — enough to place both chemical fuels far outside the range any battery chemistry has reached [8]. But gasoline has no specific power of its own: a fuel tank does not discharge itself. Its delivery rate is set by the engine burning it, not by the fuel, which is exactly the distinction the Ragone plot is built to expose — specific power is a property of the whole energy-conversion system, while specific energy, for a chemical fuel, is close to a property of the material alone.
What the chart leaves out
A Ragone plot answers exactly one question — energy versus power at a point in time — and says nothing about several factors that actually decide which technology gets deployed. Cycle life varies by an order of magnitude within a single row of the table above: the 2018 lead-acid review reports 1,500–5,000 cycles for conventional lead-acid against 1,000–5,000 for the lithium-ion systems it compares, while flywheels and supercapacitors are commonly rated past 200,000–1,000,000 cycles because they involve no chemical phase change at all [5, 3]. Installed cost tracks almost the opposite ranking from specific energy: the same review put lead-acid system cost at $150–200 per kWh against $600–800 per kWh for lithium-ion, even though lithium-ion wins decisively on the Ragone axes [5]. Safety and calendar ageing — a cell that loses capacity sitting unused, independent of how many times it has cycled — belong to chemistry and packaging details a specific-energy number cannot carry. A chart built to make one trade-off visible necessarily hides every other one, and a piece built on that chart has an obligation to say so plainly rather than let the axes imply they are the whole story.
Reading the empty corner
Set against a century of proposed “breakthroughs” in energy storage, the Ragone plot is a useful discipline precisely because it is unforgiving about direction. A new electrode material that raises specific energy while specific power falls proportionally has moved along the existing curve — useful, sometimes commercially decisive, but not a change in what is physically possible. A change that pushes a technology measurably toward the empty upper right — more energy at unchanged power, or more power at unchanged energy, without trading one for the other — is the rarer and more consequential kind of result, and it is the one the plot makes almost impossible to fake. From Ragone’s 1968 comparison of automotive battery chemistries [1] to a 2023 review cataloguing the chart’s spread across desalination and superconducting storage [2], the axes have not changed. What has changed, family by family, is exactly how close each technology can get to a corner that, even now, sits mostly empty.