Three research groups, none of them in competition with each other, spend their careers answering versions of the same question — how does a population change under selection, and how do new forms arise — using methods that share almost no infrastructure. One group spends six months a year on a half-kilometre volcanic islet, catching the same birds by hand every wet season for four decades. Another transfers a millilitre of bacterial broth into fresh medium every single day, for over 35 years and 80,000 generations, freezing a sample every 500 generations so the past is never lost. A third never touches a living organism at all: it aligns DNA sequences from hundreds of species already collected by other people, builds a tree of who is related to whom, and reads the history of selection off the branch lengths and the pattern of substitutions.
Popular accounts of evolution tend to flatten this into one generic picture — scientists studying how species change — as if the three approaches were interchangeable ways of reaching the same answer. They are not. Each buys a specific kind of evidence at a specific cost, and the costs are not the same cost. A long-term field study buys ecological realism at the price of confounded variables it cannot control. A laboratory experiment buys causal certainty at the price of a simplified world that may not resemble anything outside the incubator. A comparative phylogenetic analysis buys enormous scope — thousands of lineages, hundreds of millions of years — at the price of never watching selection actually happen. None of the three is a weaker version of the others; each is doing a job the other two cannot do. The point of laying them side by side is not to declare a winner. It is to make explicit what each one is actually entitled to claim, so that a finding from one register does not get quietly upgraded into a claim that belongs to another.
Approach one: watching a real population for decades
The paradigm case is Peter and Rosemary Grant’s study of Darwin’s finches on Daphne Major, a small, uninhabited island in the Galapagos archipelago. Beginning in 1973, the Grants and their collaborators caught, measured, weighed, blood-sampled, and individually marked essentially every medium ground finch and every cactus finch on the island, year after year, through droughts, El Nino floods, and ordinary seasons, for four decades [1]. Because the census was near-total rather than a sample, and because it ran across real weather extremes rather than a fixed experimental window, the Grants could watch natural selection act on beak size and shape in close to real time. During the severe 1977 drought, small hard seeds became scarce and large tough seeds dominated the remaining supply; birds with larger, deeper beaks survived at higher rates than smaller-beaked birds, and the population’s average beak dimensions shifted measurably within a single generation. The subsequent wet years, and later El Nino events that flooded the island with small soft seeds, selected in the opposite direction, and the population’s morphology tracked those reversals [1] [2]. In 1981 a large male immigrant finch from a neighboring island interbred with a resident female; the lineage that descended from that single hybridization event was reproductively isolated enough from both parent populations, within a few generations, that its descendants are now treated as an incipient new species — one of the only cases in which the origin of a lineage plausibly on its way to full species status has been observed directly rather than inferred after the fact [2].
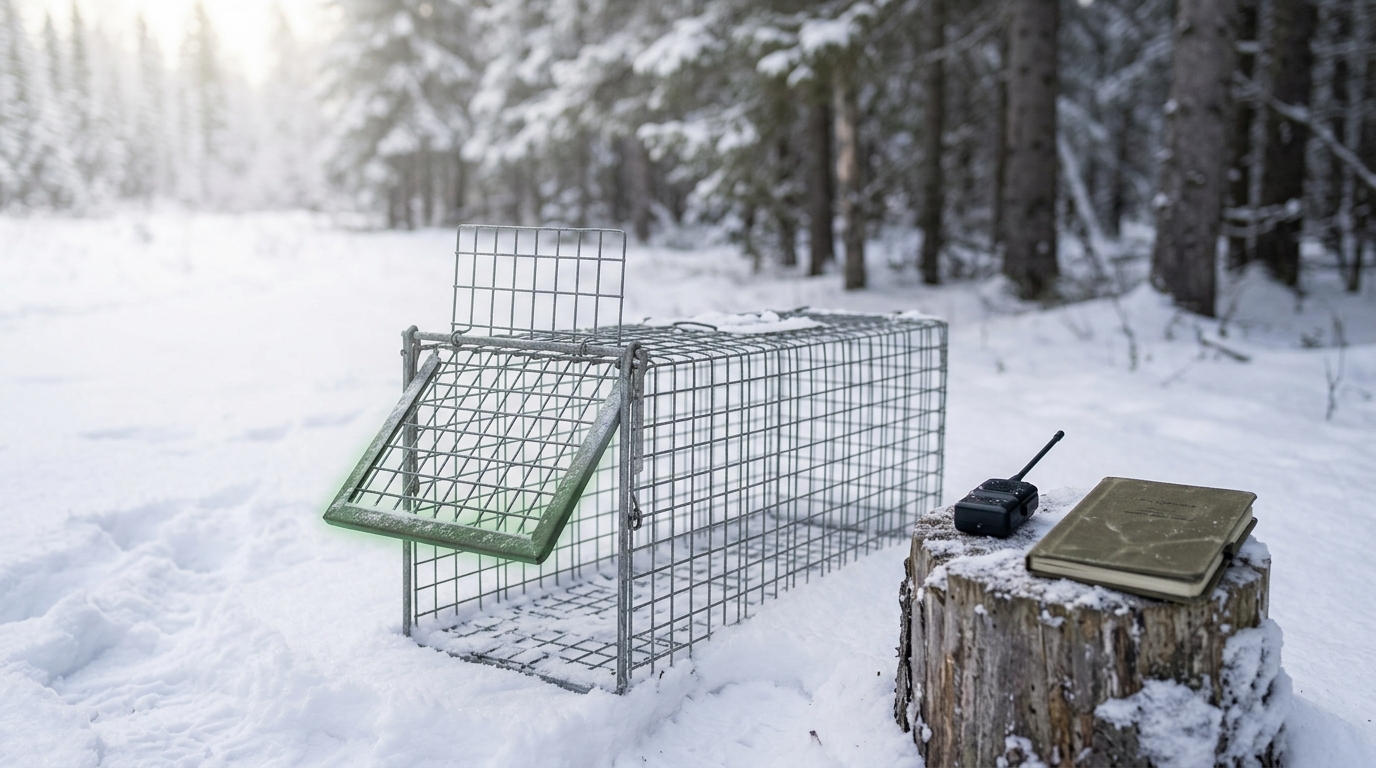
A structurally similar long-term commitment underlies the Kluane snowshoe hare project in the southwestern Yukon, running continuously since the mid-1970s. Snowshoe hare populations across the boreal forest rise and crash roughly every ten years, by up to a factor of forty, in a cycle tightly tracked by their principal predator, the Canada lynx, with a one- to two-year lag [5]. The Kluane team ran a large factorial field experiment — adding supplemental food, excluding mammalian predators with fencing, and combining both treatments — across multiple 10-year-scale replicate cycles. The result was not the simple bottom-up story the initial design was built to test. Food addition alone did not raise hare densities as much as expected, and predator exclusion alone did somewhat more; but the combined treatment produced densities far above either single treatment, even though the food-supplemented, predator-free hares showed no signs of malnutrition. The resolving piece of evidence came from measuring stress hormones in free-ranging hares: predation risk itself, independent of whether an individual hare was actually caught, elevated maternal stress hormones enough to suppress reproduction, and that stress signature was transmitted to offspring across generations, which helps explain why hare numbers keep falling for one to three years even after predator numbers have already dropped [5].
What both projects share, and what defines the field-observation approach generally, is duration married to realism. Selection pressures are whatever the real climate, real predators, and real competitors actually impose, with no experimenter deciding in advance which variables matter. That realism is also the approach’s central limitation: an El Nino year and a drought year differ in a great many correlated ways at once, so attributing a shift in beak size or hare density to any one causal factor always rests partly on inference rather than direct manipulation, however carefully the natural “treatments” are documented. Field studies also cannot be repeated on demand — there is exactly one Daphne Major history and one Kluane Valley cycle sequence, not a family of independent replicate islands or valleys running in parallel — so statistical replication in the field usually means replicating across cycles or sites rather than across truly independent trials of the same starting conditions.
Approach two: rerunning evolution in the laboratory
Richard Lenski’s E. coli long-term evolution experiment, begun in February 1988, takes the opposite trade. Twelve populations, all founded from a single ancestral clone, have been propagated in identical flasks of glucose-limited minimal medium ever since, with a 1-in-100 dilution transferred into fresh medium every single day. By August 2024 the lineages had passed 80,000 generations, and because a frozen sample is archived every 500 generations, the entire evolutionary history of every population is preserved as a literal “frozen fossil record” that can be revived and rerun at will [3]. All twelve populations improved in competitive fitness relative to their ancestor, rapidly at first and more slowly later, roughly consistent with diminishing-returns adaptation to a fixed environment; several evolved defects in DNA repair that raised their mutation rates; and lineages within a single flask diversified into coexisting ecological variants even though the flask offers no obvious spatial structure [3].
The most striking single event in the experiment’s history illustrates exactly what the laboratory approach can prove that field observation cannot. Around generation 31,500, one population, designated Ara-3, evolved the ability to grow aerobically on citrate, a carbon source present in the medium in excess but one that essentially all natural E. coli lineages cannot use without oxygen present as they normally encounter it. Blount, Borland, and Lenski used the frozen archive to answer a question that would be unanswerable in the wild: was this a one-in-a-trillion mutational fluke, or had the Ara-3 population’s own earlier history made the trait accessible in a way the other eleven populations’ histories had not? By reviving frozen ancestors from many generations before the citrate-using variant appeared and replaying evolution forward from each of those starting points thousands of times, they showed that only ancestors sampled from generation 20,000 onward in that specific lineage ever regained the ability to re-evolve citrate use, and even then only rarely — direct evidence that an earlier, itself unremarkable “potentiating” mutation had to occur first, before a later mutation could actualize the new trait [4]. That is a causal claim about historical contingency that no amount of watching wild finches or wild hares could deliver, precisely because the wild populations cannot be rewound and replayed from a saved checkpoint.


The cost of that causal power is the artificiality of the world in which it is purchased. A flask of glucose-limited minimal medium held at constant temperature has essentially no predators, no seasons, no spatial structure, and only the single resource axis the experimenters chose to limit; it is evolution under one specific, simplified, human-imposed selective regime, repeated because that regime is exactly reproducible, not because it represents the range of regimes any wild population actually experiences. A result from the LTEE — that citrate use required a potentiating mutation, or that fitness gains decelerate under a fixed nutrient limitation — is a fact about E. coli under those specific flask conditions with a very high degree of certainty. Whether an analogous form of contingency is common or rare in, say, a wild finch population’s response to droughts is a separate empirical question the flask experiment does not and cannot answer by itself.
A basic model of directional selection acting on a single locus, of the kind both the field and
laboratory results above are ultimately interpreted against, describes how an allele’s frequency
changes by one generation under a constant selection coefficient
The equation exposes the model’s real content: selection is strongest while the favored allele is at
intermediate frequency, where
Approach three: reading history off the tree
The third approach never observes a single generation turn over. Comparative phylogenetics and genomics start from DNA sequence data already collected from many species — sometimes hundreds or thousands of them — build an estimated tree of their relationships, and ask what pattern of trait values or substitution rates across that tree is consistent with which evolutionary process. The foundational statistical problem this approach had to solve is that species are not independent data points: two closely related species resemble each other partly because of shared ancestry, not because whatever trait is being studied evolved independently and convergently in both. Joseph Felsenstein’s 1985 method of “independent contrasts” solved this by using the tree itself, plus an assumed model of trait evolution, to transform raw species measurements into a set of statistically independent values before any correlation or regression is run — a computational move that made rigorous cross-species comparison possible at all, and that underlies essentially every modern phylogenetic comparative analysis [6].

What comparative genomics buys is scope no field study or laboratory experiment could reach in a human lifetime: it can ask whether a trait evolved convergently across dozens of independent lineages, estimate rates of speciation and extinction across a whole clade over tens or hundreds of millions of years, and detect the molecular signature of past selection — an excess of amino-acid- changing substitutions relative to silent ones — in genes no living researcher will ever watch change in real time. It is the only one of the three approaches that can speak to deep-time questions such as why some clades of beetles or cichlid fish have diversified into thousands of species while sister clades of similar age have stayed small.
What it gives up is direct causal demonstration. A phylogenetic comparative analysis can show that a trait and an ecological variable are correlated across the tree in a pattern unlikely to arise by chance alone, and, with a fossil-calibrated tree and a model of trait evolution, can estimate when and how fast a change occurred; it cannot manipulate an ancestral population and watch what happens, the way the LTEE’s replay experiments did, and it cannot watch selection act on a real population across a real drought, the way the Grants did. Its inferences are conditional on the correctness of the phylogeny itself and of the assumed model of how the trait evolves along branches — assumptions that are usually reasonable but are assumptions nonetheless, not direct observations.
The three dimensions that actually differ
Set side by side, the three approaches trade off along three axes that are worth separating explicitly, because popular writing about evolution tends to compress them into one undifferentiated notion of “evidence.”
Timescale. Field studies like Daphne Major and Kluane report on years to decades of a single population’s real history. The LTEE reports on tens of thousands of generations of a microorganism whose generation time is roughly 6.6 per day, which compresses enormous evolutionary time into laboratory-tractable calendar time, but only for an organism that reproduces that fast; the same design is not available for a bird or a mammal. Comparative genomics reports on the entire history of a clade, sometimes hundreds of millions of years, but only in the coarse-grained, aggregated form that surviving DNA sequences and a fossil-calibrated tree can supply — it cannot resolve what happened in any single generation.
Causal strength. The laboratory approach supports the strongest causal claims, because treatments are assigned by the experimenter and populations can be replayed from a frozen checkpoint, as the citrate replay experiments demonstrate directly [4]. Field studies support strong but not fully controlled causal claims: the Kluane factorial design manipulated food and predation directly, which is why it could distinguish a food effect from a predation-stress effect at all, but the “treatments” nature supplies in an unmanipulated year — a drought, an El Nino — are natural experiments the researchers must interpret rather than variables they assigned [5]. Comparative genomics supports the weakest causal claims in the strict sense: its evidence is fundamentally correlational across lineages, however statistically sophisticated the correction for shared ancestry becomes [6].
Generalizability. Here the ranking reverses. A result from one flask lineage of E. coli generalizes with high confidence to the other eleven flask lineages run under the same protocol, and with much lower confidence to a wild bacterial population living in a gut or a soil crust facing fluctuating resources, predation by phage, and horizontal gene transfer. A result from Daphne Major generalizes with reasonable confidence to other Galapagos finch populations facing similar climatic regimes, and with less confidence to species with different life histories elsewhere. A comparative genomic finding about, say, a consistent association between body size and diversification rate across hundreds of independent lineages of a clade is, by construction, already a statement about generality across many populations and species — that is what it means for the analysis to include them all.
No approach dominates on all three axes simultaneously, which is the actual reason all three persist as active, well-funded research traditions rather than one having superseded the others. A finding that survives translation across all three registers — an LTEE-style mechanism that a comparative genomic scan also finds evidence for across independent wild lineages, corroborated by a field study showing the predicted selection pressure actually occurs in nature — is a rare and valuable kind of convergent evidence precisely because each approach could have failed to confirm it for reasons specific to that approach alone.
Extending the comparison to ecosystems
The same three-way tension reappears, largely unchanged in structure, once the unit of study moves from a single population to whole ecosystems and questions of biodiversity and extinction. Long-term biodiversity monitoring plays the role field studies play at the population level: the Living Planet Index, jointly maintained by the Zoological Society of London and WWF, aggregates population trend data from tens of thousands of monitored vertebrate populations across land, freshwater, and marine systems worldwide into a single global trend measure, precisely because no single site’s record is informative about a global pattern on its own [7]. The IUCN Red List plays a related but distinct role: rather than tracking continuous population trends, it periodically classifies the extinction risk of an assessed species against fixed criteria — rate of decline, population size, range size and fragmentation — and by the early 2020s had assessed roughly 150,000 species, of which around 42,000 were classified as threatened [8].
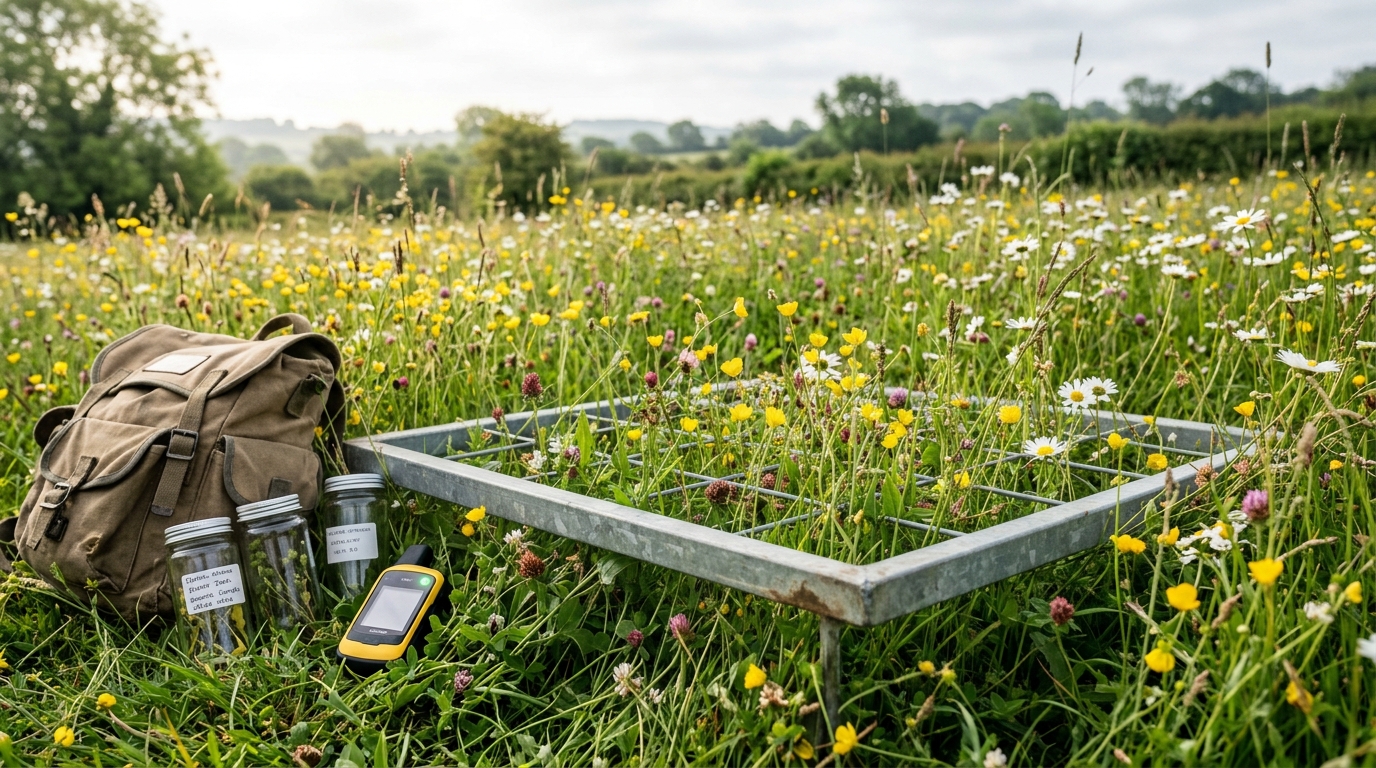
Both of these are observational, aggregative instruments, not experiments; nothing at ecosystem scale corresponds cleanly to a replayed LTEE flask, because no one can rerun a century of a real ecosystem’s history from a frozen checkpoint under alternative conditions. Where something closer to the experimental register does exist at this scale — manipulated whole-lake or whole-watershed studies, exclusion-fence experiments like the food-and-predator design at Kluane, or replicated mesocosm experiments — it buys the same causal clarity the LTEE buys, at the same cost of operating over a smaller area, a shorter duration, and a simplified subset of the real ecosystem’s complexity [5]. Comparative approaches, meanwhile, extend upward from single-clade phylogenies to cross-ecosystem comparative ecology — asking, for instance, whether island ecosystems of a given size and isolation reliably show a particular relationship between area and species richness across many independent islands — carrying the same strengths and the same correlational limits described above for phylogenetics.
Reading claims about anthropogenic change against this framework
This three-way structure matters most, in practice, for judging claims about human-driven ecological change, because the three kinds of evidence are not interchangeable there either. A specific, well-documented case — the measured decline in a particular monitored population, or the classification of a particular species’ extinction risk against IUCN criteria — is a fact, evidenced the way a field observation is evidenced: directly measured, for that population, over that period [7] [8]. An aggregate index built from thousands of such records, like the Living Planet Index’s global trend figure, is an analysis: a specific statistical method for combining many individual population trends into one number, which is informative but depends on which populations were monitored and how the aggregation is weighted, and should be read with that method in view rather than as a single unmediated fact about “wildlife” in general. Extrapolating either kind of record forward — projecting how many more species will become threatened, or how a specific ecosystem will respond to a specific future warming trajectory — is a scenario or prediction, not a fact or even an analysis of already-collected data, and it is only as good as its stated assumptions, its time horizon, and the observable indicators that would show it was wrong. A defensible prediction in this domain names all three: for example, a claim that a given monitored vertebrate population will continue declining at its current rate over the next decade should specify the rate, the decade, the assumption that current pressures (habitat loss, harvest, climate trend) continue unchanged, and the condition — a measured reversal of the trend within that window — that would disconfirm it. Absent that structure, a scenario is doing the rhetorical work of a fact without having earned it.
What the comparison is not
None of this is an argument that one of the three approaches is more rigorous, more scientific, or more trustworthy than the others; each is simply answering a different question, and each would produce a worse answer to the other two approaches’ questions if it tried to substitute for them. A laboratory chemostat cannot tell you whether Darwin’s finches are still diverging into separate species on Daphne Major, because that requires watching an actual wild population’s actual mating patterns over actual decades. A four-decade field census cannot tell you whether a particular mutation was causally necessary before a later one could have its effect, because that requires a frozen archive and the ability to replay history, which no wild population offers. A phylogenetic comparative analysis cannot tell you what stress hormones are doing to a snowshoe hare’s fecundity this winter, because it was never designed to look inside a single population’s physiology at all. Evolutionary biology and ecology hold together as unified fields not because these three approaches converge on one method, but because they are stitched together by researchers who move between them, checking a laboratory mechanism against a comparative pattern across wild lineages, or a comparative pattern against a field measurement of the selection pressure it implies actually exists in nature.