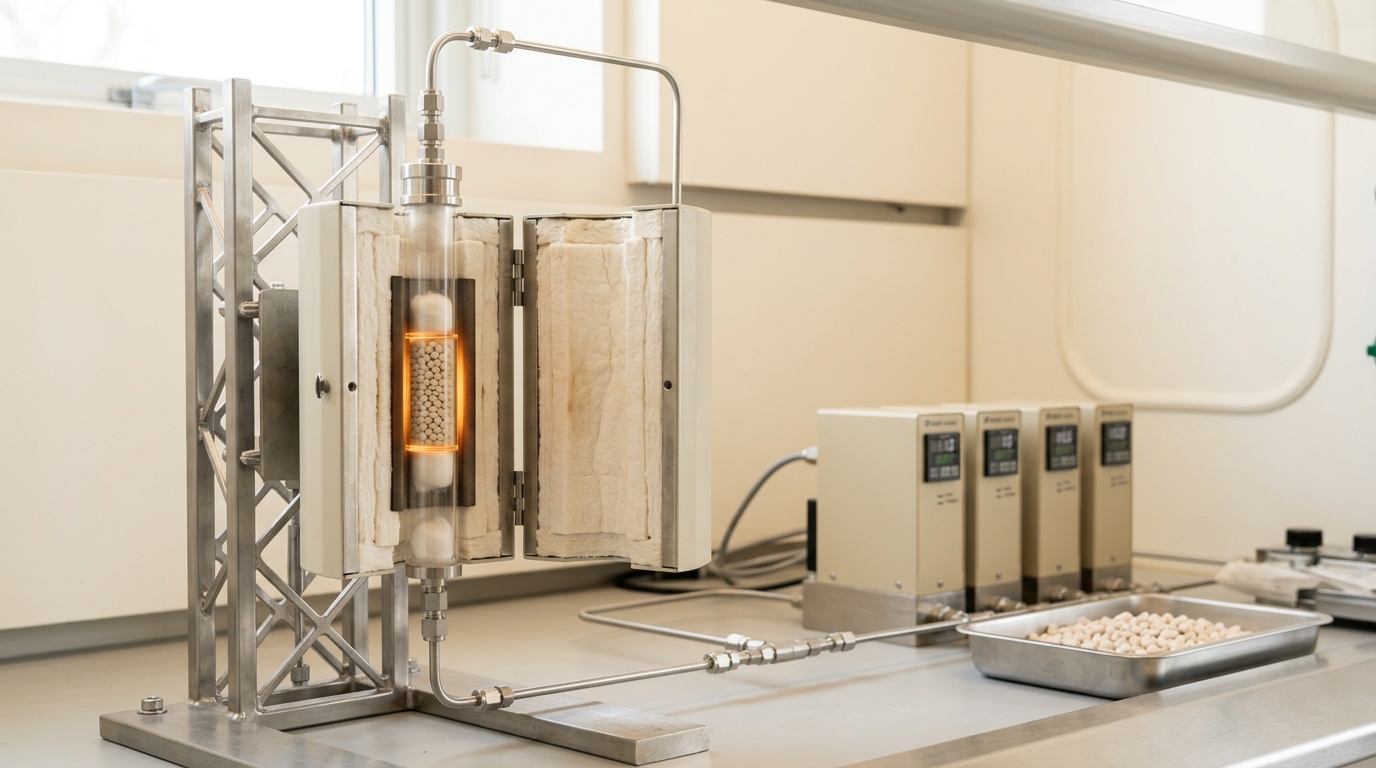
A catalyst that “works” in a first screening test has told you almost nothing. It has told you that a candidate material takes a feed and gives a product at a measurable rate, under one set of conditions, for as long as the run lasted. It has not told you which step of the mechanism is actually slow, whether the surface you characterized before the reaction still exists after the reaction, whether the selectivity holds outside the narrow window you tested, or whether the material will still be doing useful work a thousand hours from now. Closing each of those gaps requires a different measurement, and conflating them — reporting activity as if it were mechanism, or a fresh-catalyst structure as if it described the working state — is the most common way catalysis claims go wrong in both directions: overclaimed in press releases, and under-trusted by reviewers who have seen the overclaiming before.
This guide walks through what a rigorous characterization campaign for a new catalyst actually involves, in the order a careful lab would run it: bounding the kinetics, using isotopes to locate the rate-controlling step, watching the active site under real reaction conditions with operando spectroscopy, and then deliberately aging the material to find out how and when it stops working. Every claim below is tied to a specific peer-reviewed source or standards document; where the practice diverges from what a technique can actually prove, that gap is called out explicitly rather than smoothed over.
Starting from kinetics, not activity
The first number anyone reports for a new catalyst is usually a turnover frequency or a conversion percentage at some temperature. That number is a fact, but on its own it is nearly useless for mechanism: two catalysts with identical turnover frequencies can be limited by completely different elementary steps, and a catalyst’s apparent activation energy is an average over whatever step or steps happen to control the rate under the tested conditions, not a property of a single bond.
The rigorous move is Charles Campbell’s degree of rate control (DRC) framework, which asks, for each elementary step, how much the overall rate would change if that step’s rate constant were perturbed while holding all others fixed [1]. A step with a DRC near one is rate-controlling; a step with a DRC near zero is kinetically irrelevant even if it is thermodynamically significant. This is not a qualitative heuristic — it is a derivative of the log of the rate with respect to the log of a single rate constant, evaluated at the reaction conditions of interest, and it can be computed from a microkinetic model built on density-functional or experimental barriers.
Here
Kinetic isotope effects: forcing the mechanism to reveal itself
Kinetic isotope effects — the ratio of the rate constant for a light isotope (usually H) to a heavy isotope (usually D) — have been a mechanistic workhorse for decades because they respond almost entirely to whether a bond to that isotope is being made or broken in the rate-controlling transition state [2]. A primary KIE, where a bond to the isotopic atom is actively forming or breaking, can produce rate ratios well above one; a secondary KIE, where the isotope is a bystander whose bonding environment merely changes hybridization, gives a much smaller shift, often close to unity.
Fact, verified from source. Mao and Campbell showed that the observed KIE in a multistep catalytic mechanism is not simply the intrinsic KIE of whichever step involves the isotope-sensitive bond; it is a DRC-weighted combination across all steps, because steps that are kinetically silent can still “hide” the isotope effect of the chemical step that actually involves the bond [2]. This phenomenon, sometimes called kinetic complexity, is why a measured KIE close to one does not always mean the bond-breaking step is not rate-limiting — it can also mean that step’s DRC is small even though its intrinsic isotope sensitivity is large.
Vendor-style overclaim to watch for. A company’s technical brief that reports “KIE = 3.8, confirming the C–H activation mechanism” is stating a fact about the measurement but overstating its certainty as a mechanistic proof. A KIE of that magnitude is consistent with a rate-controlling C–H cleavage, but it is also consistent with a rate-controlling step earlier in the mechanism whose transition state partially reflects the same bond reorganization through a shared intermediate. The honest claim is narrower: the observed KIE is consistent with, and provides supporting evidence for, C–H bond cleavage playing a significant role in the rate-controlling chemistry — not that it proves a single elementary step in isolation.
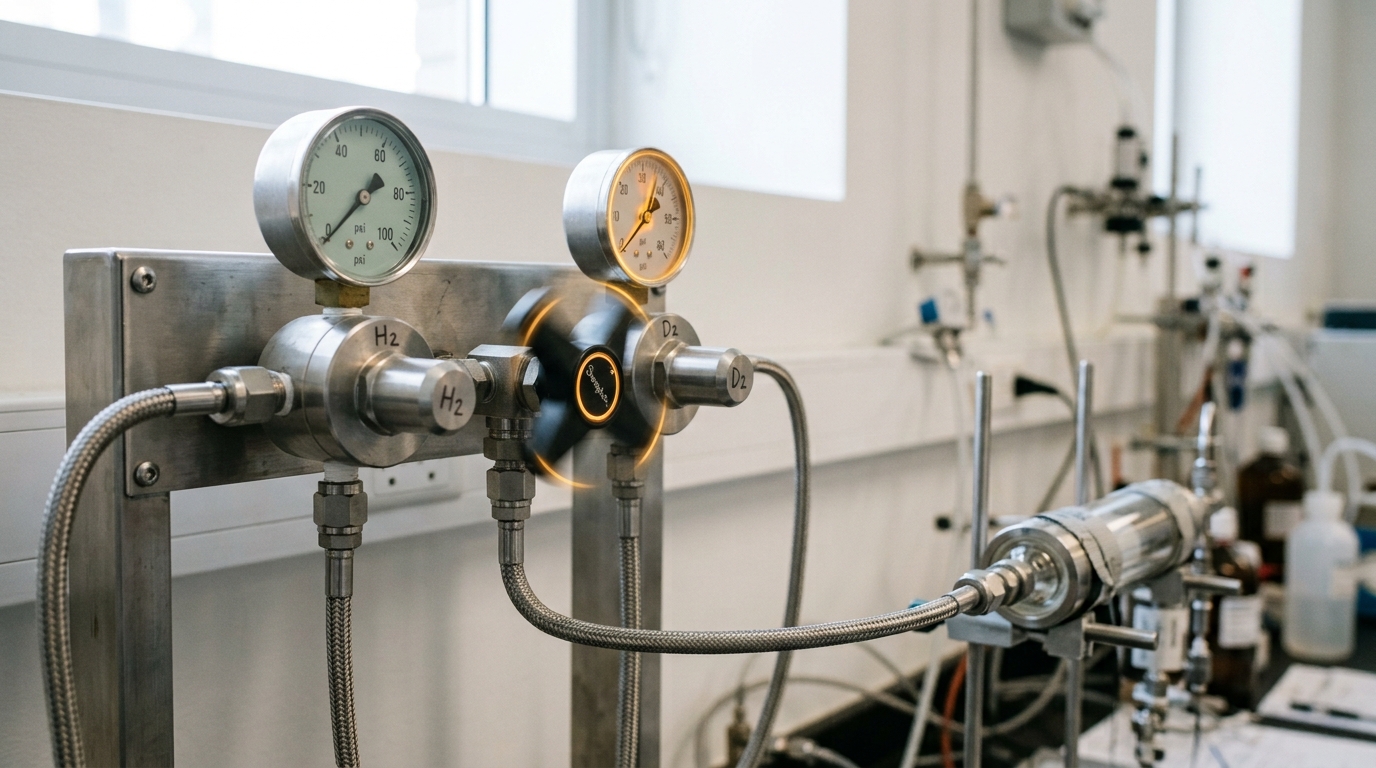
Analysis. The practical protocol most labs actually run is a matched pair of experiments: identical reactor, identical catalyst batch, identical space velocity, with only the isotopic label of one reactant switched between H and D feeds, ideally with both feeds run in the same session to cancel slow catalyst drift. Because the DRC-weighted interpretation requires knowing (or at least bounding) the DRC of the isotope-sensitive step, a KIE measurement is most convincing when paired with a microkinetic model, however approximate, rather than reported as a bare number.
Watching the active site under real reaction conditions
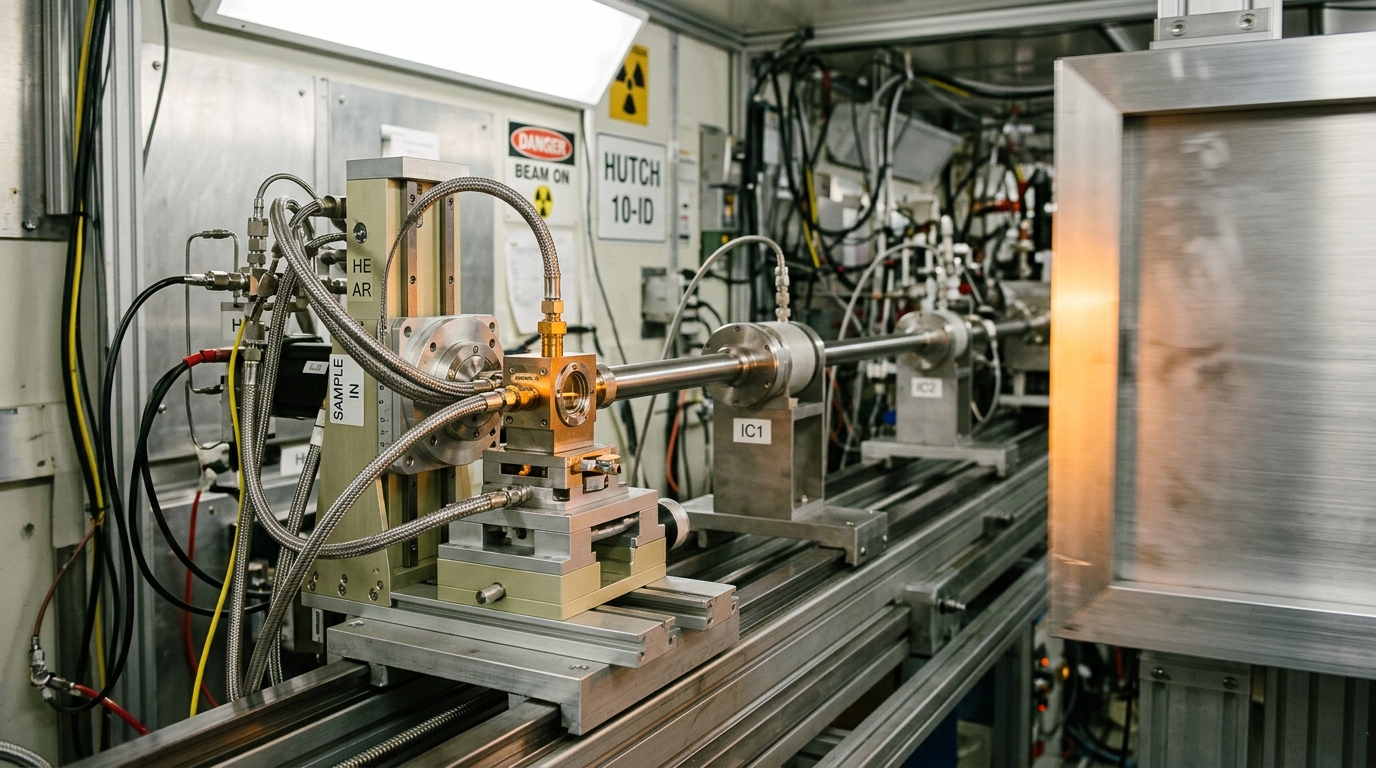
The central problem in heterogeneous and electro-catalysis is that the surface characterized before the reaction — by ex situ electron microscopy, X-ray diffraction, or X-ray photoelectron spectroscopy under vacuum — is frequently not the surface that is actually catalytic. Oxide catalysts reduce, restructure, or leach a component under a reducing feed; electrocatalyst nanoparticles reconstruct at applied potential; supported single atoms can sinter, migrate, or change oxidation state the moment reaction gas and temperature are applied together. This is the reason operando measurement — probing the catalyst while it is simultaneously exposed to reaction gas or electrolyte, at reaction temperature or potential, and while its activity is being measured in parallel — has become close to a requirement for a credible mechanistic claim, rather than an optional extra.
Operando X-ray absorption spectroscopy (XAS). X-ray absorption near-edge structure (XANES) reports the oxidation state and local symmetry of the absorbing element; extended X-ray absorption fine structure (EXAFS) reports coordination number and bond distances to nearest neighbors. Timoshenko and Roldan Cuenya’s review lays out how operando XAS has been used specifically to track electrocatalysts’ structural, chemical, and electronic transformations as they adapt to reaction conditions — including cases where a catalyst’s oxidation state measured in situ under applied potential differs measurably from its as-prepared state [3]. The technique’s strength is elemental specificity and applicability to amorphous or nanoscale materials that lack long-range crystalline order; its central limitation is that it reports an average over every absorbing atom in the X-ray beam path, so a minority active-site population — often the one actually doing the catalysis — can be diluted below detection by a majority of spectator atoms.
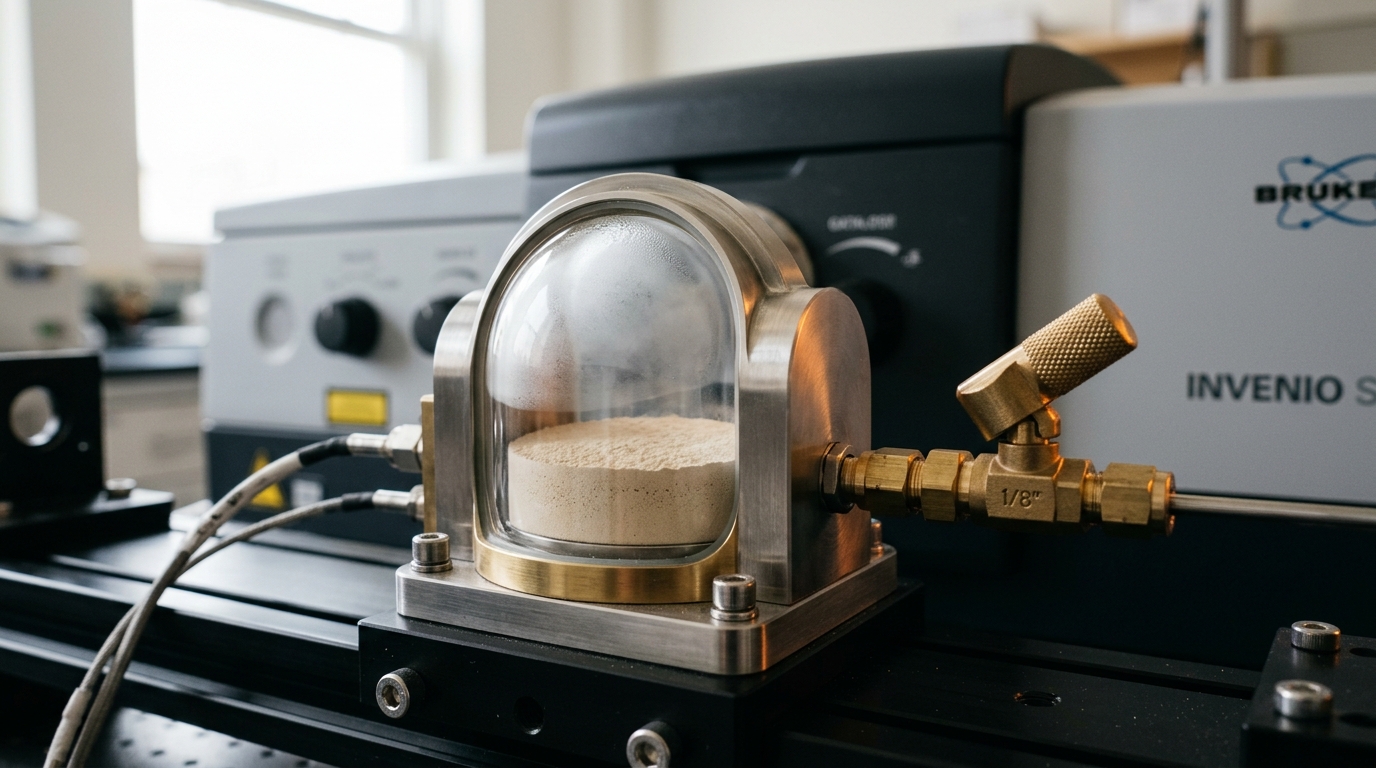
Operando diffuse-reflectance infrared spectroscopy (DRIFTS). Where XAS reports the metal or support, DRIFTS reports the adsorbed species: which intermediates are sitting on the surface, in what relative populations, while gas flows over a powder bed at reaction temperature. A 2025 review in Nature Communications on operando infrared spectroscopy for heterogeneous catalytic mechanisms is explicit about a limitation practitioners need to carry into interpretation: DRIFTS has a shallow analysis depth, sometimes under four micrometers, so its signal is weighted toward the top of the catalyst bed and may not represent the bulk of the powder equally, and combined DRIFTS–XAS cell designs must be read with that mismatch in mind [4].
Combining the two. Because XAS and DRIFTS probe different parts of the catalytic system (the solid framework versus the adsorbed layer) at different sampling depths, the strongest operando campaigns run both simultaneously on the same cell, cross-checking that a spectral change attributed to a restructuring event in XAS coincides in time with an intermediate appearing or disappearing in DRIFTS. Neither technique alone rules out a change occurring somewhere the probe cannot see.
Selectivity, Sabatier’s principle, and the volcano plot
A catalyst’s selectivity — the fraction of converted feed that ends up as the desired product rather than a side product — is frequently the commercially decisive number, and it is governed by a different logic than raw activity. Sabatier’s principle states, for a mechanism with an adsorbed intermediate, that the optimal catalyst binds that intermediate neither so weakly that it never adsorbs nor so strongly that it never desorbs; plotting activity against binding energy across a series of candidate catalysts produces the characteristic volcano shape, with the summit near intermediate binding strength [9].
Fact. Density-functional-theory-derived volcano plots for the oxygen reduction reaction, built from computed oxygen and hydroxyl adsorption energies across transition metals, correctly rank several noble-metal catalysts’ relative activities and have guided alloy catalyst design for over a decade [9].
A 2024 experimental validation. A Sabatier-plot study on oxygen electroreduction went further than computation, using molecular-level microenvironment customization to experimentally tune the binding strength of the *OH intermediate and directly validate the predicted volcano relationship, showing that electron-withdrawing substituents on the catalyst’s local environment mitigate over-strong *OH adsorption [10]. This closes a gap that DFT-only volcano plots have long had — the shape was predicted computationally well before it was demonstrated this directly in a single controlled experimental series.
Where the simple picture breaks down — stated as analysis, not fact. Single-atom catalysts and high-entropy alloys increasingly show activities that do not sit on the classical volcano built from bulk-metal descriptors, because a single isolated site or a disordered multi-element surface can decouple binding energies that scale together on close-packed metal surfaces. This is not a refutation of Sabatier’s principle so much as a sign that the one-descriptor volcano is a simplified model whose assumptions — that binding energies of related intermediates scale linearly with each other — do not hold for every catalyst family. Treat a volcano-plot ranking as strong evidence for materials similar to those in the original series, and as a weaker prior, not a settled prediction, for a structurally distinct catalyst class.
A parallel path: photocatalysis and semiconductor charge carriers
Photocatalytic reactions, most commonly semiconductor-mediated water splitting, run on a different rate-limiting logic than thermal or electrochemical catalysis: the reaction proceeds only as fast as photon absorption generates electron-hole pairs, those carriers separate and migrate to the surface without recombining, and the surface redox chemistry consumes them before they can recombine there instead [11]. Titanium dioxide is the most studied photocatalyst for exactly this reason — it is inexpensive, chemically robust, and non-toxic — but its practical efficiency is limited by a wide band gap that absorbs only the ultraviolet fraction of sunlight and by fast recombination of the photogenerated pairs before they reach the surface [11].
Fact. Strategies reviewed for mitigating this recombination bottleneck include doping to introduce sub-gap states, and heterojunction or Z-scheme architectures that pair two semiconductors so that photogenerated electrons in one material’s conduction band recombine preferentially with holes in the other’s valence band, leaving the more energetic carriers in each material free to drive the desired redox half-reaction [11].
Scenario, explicitly flagged as such. If a photocatalyst achieves a solar-to-hydrogen conversion efficiency competitive with established electrolysis-plus-renewable-electricity pathways at pilot scale within the next decade, direct solar photocatalytic hydrogen production could bypass a separate electricity generation and transmission step for distributed hydrogen production. This is a scenario, not a forecast: it assumes continued reduction in recombination losses, a stable catalyst under prolonged solar-intensity illumination (a wear mechanism distinct from the electrochemical degradation discussed below), and a manufacturing cost per unit of catalyst surface area low enough to compete with electrolyzer capital cost. An observable indicator that the scenario is on track would be a peer-reviewed, third-party-verified solar-to-hydrogen efficiency sustained for a multi-week outdoor test, rather than a single-day laboratory result under a solar simulator. The disconfirming condition is straightforward: if best reported sustained efficiencies plateau over several more years of publication rather than continuing to climb, that is evidence the scenario is not materializing on this horizon.

Testing whether the catalyst survives — accelerated stress protocols
A catalyst characterized only in its fresh state has been characterized incompletely, because the number that ultimately matters commercially is how long it keeps working. Running a real-time durability test to the multi-year horizon a catalyst is expected to survive is usually not practical during development, so labs instead use accelerated stress tests (AST): protocols that deliberately cycle the catalyst through conditions more aggressive than normal operation, compressing years of aging into days or weeks.
Fact, specific numbers from source. In fuel-cell electrocatalyst testing, a high-flow square-wave AST protocol demonstrated a twenty-times time-acceleration factor relative to an earlier catalyst durability AST, and a hundred-times acceleration factor relative to a modified wet drive-cycle protocol meant to simulate realistic vehicle duty cycles; a related low-flow square-wave protocol showed a five-times acceleration factor over a triangle-wave AST and a twenty-five-times factor over the same wet drive-cycle protocol [5]. These numbers matter because they are not interchangeable — a protocol’s acceleration factor depends on which specific degradation mechanism it emphasizes, so a single AST result cannot be assumed to predict lifetime under a different real-world duty cycle.
Fact. Distinct AST protocols target distinct failure modes: a start-stop protocol reproduces the potential transients seen during fuel-cell stack startup and shutdown, which drive severe carbon-support corrosion, while a load-cycling protocol reproduces full-load-to-no-load potential swings that drive platinum dissolution and redeposition rather than support corrosion [5]. Running only one protocol and reporting it as “durability” conflates two physically different failure mechanisms.
A 2024 refinement. A dynamic AST program coupled with continuous on-line analysis — rather than only pre- and post-test characterization — allowed researchers to track which components of a membrane electrode assembly (catalyst layer, carbon support, membrane, gas diffusion layer) degraded at which point in the cycling protocol and to distinguish reversible performance loss from irreversible degradation [6]. This on-line approach is a meaningful methodological step beyond the older practice of characterizing a cell only before and after a fixed number of cycles, because a fixed-endpoint test can miss transient recovery or transient acceleration that happens partway through.
Analysis: what an AST result licenses you to claim, and what it does not. An accelerated stress test can credibly demonstrate a relative ranking — catalyst A degrades faster than catalyst B under an identical protocol — and it can identify a failure mechanism when paired with post-test structural characterization. It cannot, on its own, produce a calibrated real-world lifetime prediction, because the acceleration factor itself depends on which degradation mechanism dominates in the field, which may differ across applications, climates, and duty cycles. A vendor claim of “40,000-hour equivalent lifetime” derived purely from an AST acceleration factor should be read as a claim about that protocol’s assumed correspondence to field operation, not as an independently verified field result, unless the source explicitly reports field validation alongside the AST.

Standards and terminology: why the vocabulary itself needs sourcing
Much of the confusion in catalyst characterization claims traces back to loose terminology — “active site,” “turnover number,” “selectivity,” and “surface area” are used inconsistently enough across the literature that IUPAC has maintained standing technical documents specifically to fix definitions. The 1991 Manual on Catalyst Characterization was prepared explicitly to build a characterization chart listing every parameter needed for a full catalyst description and to formalize the terminology used to report them [8], and the related 1994 technical report on the characterization of porous solids standardizes how surface area, pore size, and adsorption isotherms are measured and reported for solids used as catalyst supports [7]. Citing a measurement as, for example, a BET surface area without specifying the adsorption model and pressure range used to derive it is exactly the kind of terminology looseness these standards exist to prevent — the number is only interpretable alongside the method that produced it.
Putting the chain together
None of these techniques stands in for another. Kinetics and DRC analysis identify which step controls the rate under given conditions; kinetic isotope effects test a specific mechanistic hypothesis about that step, with the caveat that a null result can be masked by kinetic complexity; operando XAS and DRIFTS establish what the catalyst’s structure and adsorbed intermediates actually look like while it is working, not before or after; volcano-plot reasoning organizes selectivity and activity trends across a catalyst family while flagging where the underlying scaling assumptions may not hold; and accelerated stress testing establishes how the material fails and how fast, without claiming to have measured field lifetime directly. A characterization report that skips straight from an activity number to a mechanistic conclusion, or from a fresh-catalyst structure to an operating-condition claim, or from an AST result to a field-lifetime guarantee, has skipped exactly the step where the evidence actually lives. The discipline this guide describes is not exotic instrumentation for its own sake — it is the minimum evidentiary chain needed to say, with any confidence, what a catalyst is actually doing while it works and how long it will keep doing it.