Ask an energy agency, a grid engineer, and an environmental historian the same question — “how fast can an electricity system change?” — and each will answer with a different kind of number, drawn from a different kind of evidence, and each will be right about something the other two cannot see from where they stand. The agency answer comes from a statistical model calibrated on national fuel-mix data and macroeconomic assumptions. The engineer’s answer comes from measuring what a specific transformer, feeder, or interconnection can physically carry today. The historian’s answer comes from tracing, decade by decade, how long it actually took past fuel transitions to unfold once someone bothered to keep records. None of the three is a rough draft of the others. They are different instruments pointed at different parts of the same object, and a serious account of energy and infrastructure needs to know which instrument it is reading before it trusts the number that comes back.
This article lays out three traditions of studying energy, infrastructure, and civilization side by side: top-down macro energy-agency modeling, bottom-up engineering and grid-systems analysis, and historical/environmental-history case studies of past transitions. It compares them on dimensions that are actually comparable — predictive power, granularity, historical grounding, and what each treats as a fixed backdrop rather than something to explain — and it uses three worked cases to keep the comparison concrete: the 2020s buildout of renewable electricity capacity, the long-running debate over energy return on investment (EROI), and the century-long pace of historical fuel transitions. Throughout, claims are marked by kind — fact, vendor or agency assertion, peer-reviewed analysis, scenario, or prediction — because these three traditions are frequently blended in public discussion in ways that quietly upgrade a scenario into a fact.
Three units of analysis, three time horizons
The clearest way to separate these approaches is by what each one treats as its basic unit and its native time horizon.
Macro energy-agency modeling — the tradition represented by the International Energy Agency’s annual World Energy Outlook and the U.S. Energy Information Administration’s international data products — takes the national or regional fuel mix as its unit of analysis: terawatt-hours of electricity generated by source, million tonnes of oil equivalent consumed by sector, capacity additions by technology and by year [1] [2]. Its native time horizon is the multi-year to multi-decade scenario: the IEA’s flagship report is explicitly built around “possible energy futures,” not a single forecast, and it says so [1]. That is a modeling choice worth naming precisely: a scenario is a conditional statement — if these policy, price, and technology assumptions hold, then this trajectory follows — not a claim about what will happen. Aggregate compilations such as Our World in Data’s energy-production series occupy an adjacent but distinct role: they are not forecasting anything, they are assembling long, comparable historical series (drawing on sources like the Energy Institute’s Statistical Review) so that trend claims can be checked against actual recorded consumption back to 1800 [3]. That data source is explicit that global energy consumption has risen in nearly every year for over half a century, with recorded exceptions around the early 1980s, the 2009 financial crisis, and the 2020 pandemic, and that recent growth has slowed to roughly one to two percent a year [3] — a factual, backward-looking claim, distinct from any of the agencies’ forward-looking scenarios.
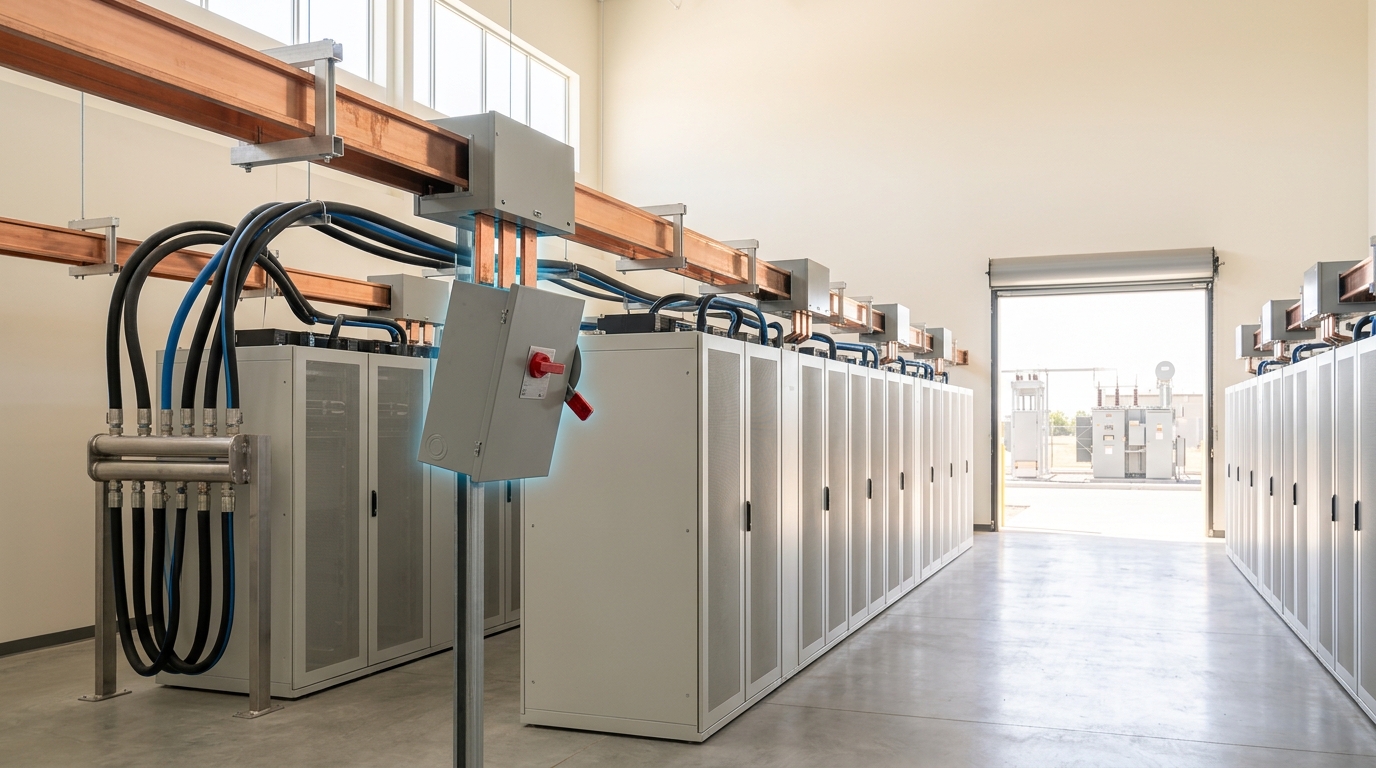
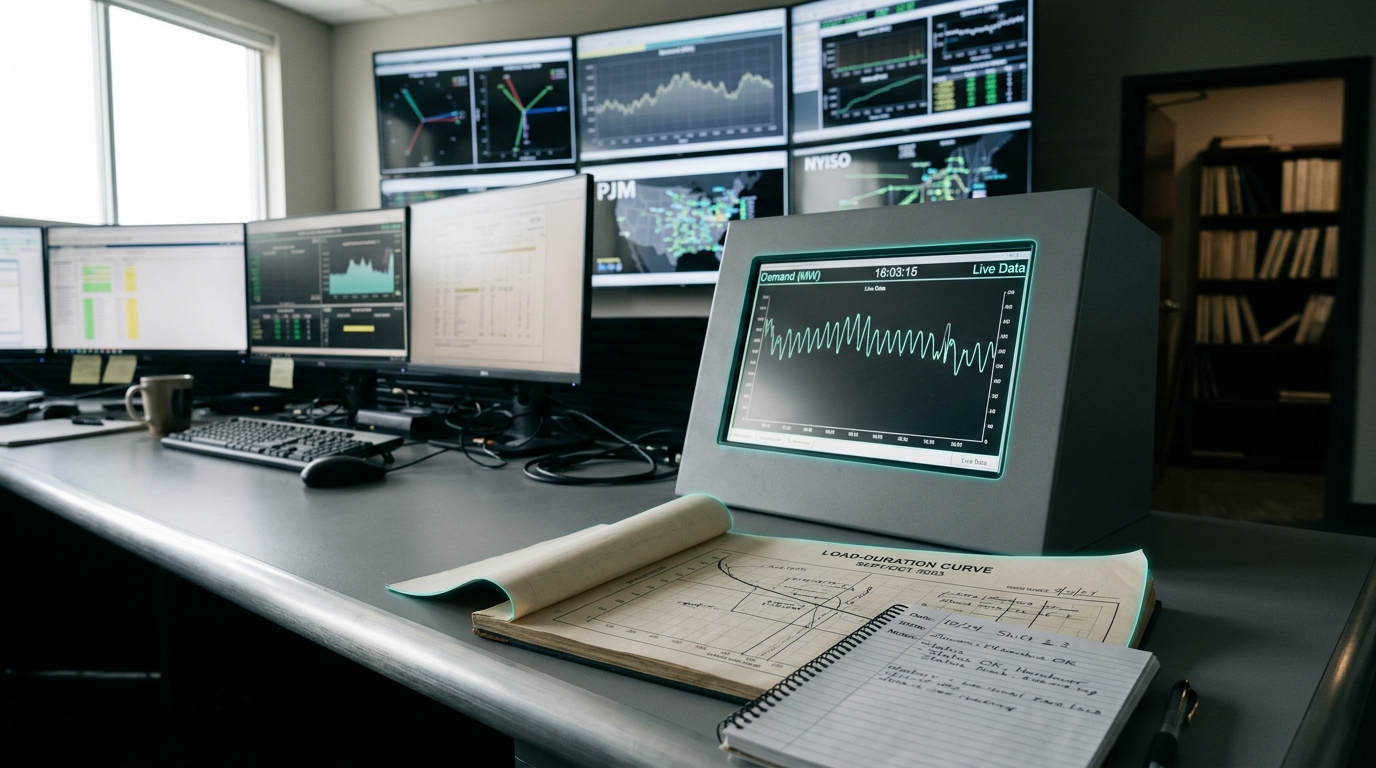
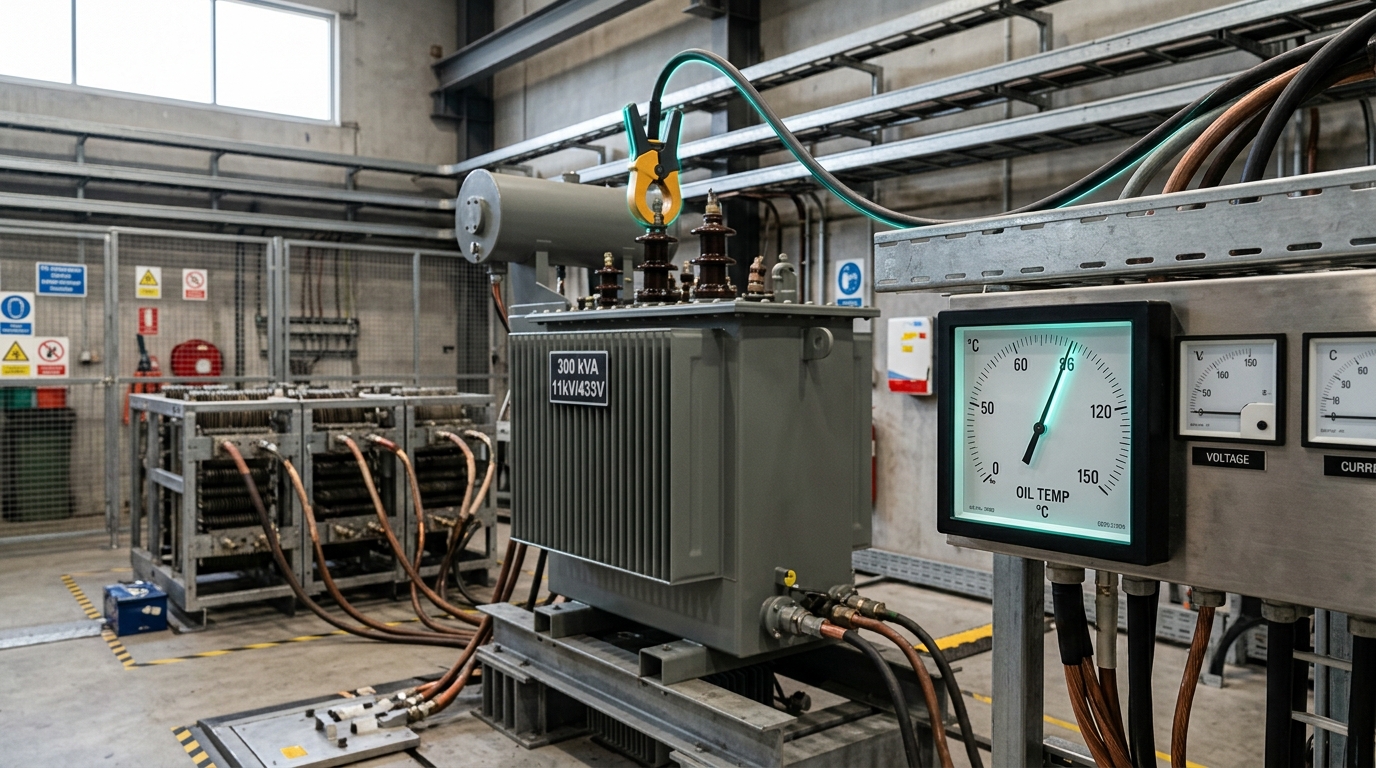
Bottom-up engineering and grid-systems analysis takes the physical asset as its unit — a transformer, a feeder line, a control area, an interconnection point — and its native time horizon is operational: seconds for frequency regulation, hours for a load-duration curve, months to years for equipment procurement and permitting. This is the discipline that actually decides whether a modeled capacity addition can be interconnected, whether a substation can absorb a doubling of feeder load, and how long a component genuinely takes to fabricate, test, and commission. It answers questions the macro models cannot, because a national aggregate has no opinion about whether one specific 138kV line is thermally constrained on a July afternoon. Where the agency traditions describe fuel shares in percentage points per year, grid engineering describes megawatts of firm capacity, interconnection queue years, and load-bank test results on individual units — evidence that is granular, verifiable by direct measurement, and almost never national in scope.
Historical and environmental-history case studies take the past transition itself as the unit — Britain’s shift from wood to coal, from coal to oil in transport, from town gas to electric light — and their native time horizon is the multi-decade-to-century retrospective. Roger Fouquet’s quantitative history of British energy transitions defines a transition explicitly, as the interval during which a fuel’s share of a specific end-use service rises from five percent to eighty percent (or to its eventual peak, if lower) [6]. Measured that way, the finding is specific and empirical rather than a general impression: sector-specific transitions in the UK took, on average, close to fifty years since the Industrial Revolution, and the fastest historical sector-specific transition on record still took roughly three decades [6] [7]. Vaclav Smil’s Energy and Civilization: A History extends the same historical-reconstruction method across ten thousand years, from foraging societies through the fossil-fuel era, tracing how energy conversions reorganized agriculture, transport, warfare, and urban life at each stage [8]. This tradition’s evidentiary base is documentary and physical — production records, trade statistics, technology-adoption counts, archaeological and engineering evidence of past capacity — rather than either a live statistical model or a live instrument feed.
What each approach is actually good at
Set against comparable dimensions, the three traditions trade off in predictable ways.
Predictive power over a policy-relevant horizon (five to twenty years) favors the macro energy-agency models, because they are built for exactly that horizon and are updated annually against realized data — the IEA revises its scenario assumptions and near-term projections in each new edition, checking the previous year’s numbers against what actually happened [1]. Grid-engineering analysis has almost no native reach on this horizon in the aggregate; it is extremely good at predicting whether one component will hold up under a specified load, but a collection of component-level answers does not automatically add up to a national trajectory unless someone builds the aggregation, which is itself a modeling exercise. Historical case studies have essentially no forward predictive claim on a twenty-year horizon by design — they are reconstructions of completed processes, not forecasts, though as discussed below they do carry a disciplining implication for the pace assumptions embedded in scenarios.
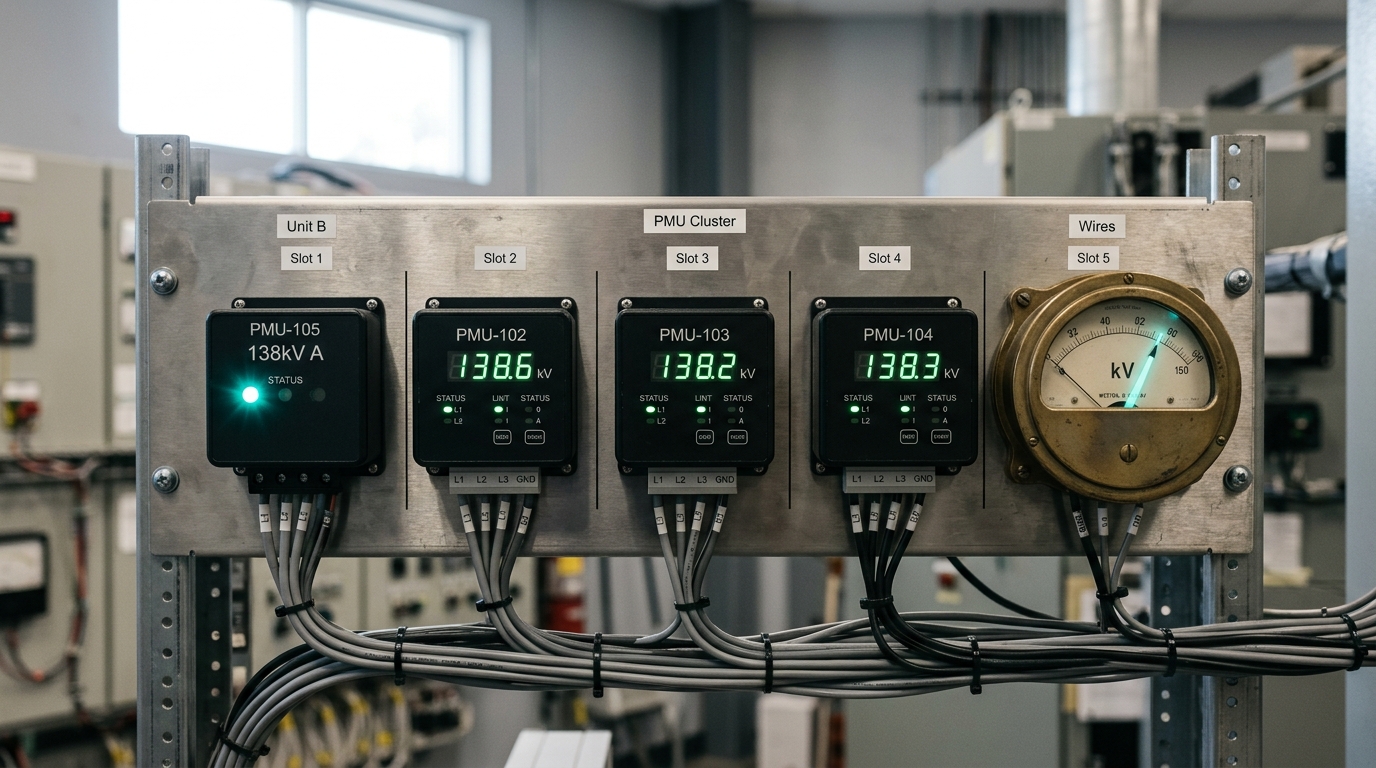
Granularity runs the other way. Grid-engineering analysis is granular by nature: a transformer test cell reports oil temperature under a specific load ramp, not an averaged national heat-tolerance figure; a phasor measurement unit reports grid frequency at a synchronized instant, not a monthly mean. Macro models necessarily average across this detail — a national or regional capacity-addition figure is a sum over thousands of individual interconnections, each with its own site-specific constraints that the aggregate number cannot represent. Historical case studies sit in between: Fouquet’s transition dating is sector-specific and service-specific (lighting, heating, motive power, each dated separately), which is considerably finer-grained than a national fuel-mix percentage, but it is still a retrospective count of adoption shares rather than a physical measurement of any one piece of equipment [6].
Historical grounding — the ability to say what has actually happened, over what actual duration, under real institutional conditions — belongs to the environmental-history tradition specifically because that is its entire method. This matters for a concrete reason: pace assumptions embedded in forward-looking energy scenarios are themselves testable against Fouquet’s and Smil’s reconstructions, and the historical record is a genuine constraint on how fast an aggregate scenario can be trusted to unfold. A scenario that assumes a national electricity system fully re-composes its generation mix in under a decade is making an assumption that the longest documented sector-specific precedent (about thirty years, for the fastest case on record) should make an analyst want to see the supporting mechanism for, not merely the modeled trend line [6]. That is a comparison the macro-modeling tradition and the engineering tradition, on their own, do not supply.
The EROI case: one number, three different uses
Energy return on investment — EROI — is a useful worked example because all three traditions touch it, and they use it for different jobs.
EROI is, at root, an engineering-adjacent accounting concept: the ratio of energy delivered by an energy-producing process to the energy consumed in finding, extracting, processing, and delivering it, a formulation originating with Charles Hall’s early work and developed with Cutler Cleveland over subsequent decades [5]. Computing an EROI number for a specific well, mine, or generation fleet requires the same kind of granular, component-level accounting that grid engineering specializes in — direct energy costs where measurable, and energy-equivalent costs derived from economic and materials data where they are not [5]. Brandt and colleagues’ widely cited 2013 comparison across fuels demonstrates this directly: it walks fuel by fuel — oil, gas, coal, biofuels, and others — computing comparable EROI ratios and flagging where methodology differs enough between studies that the ratios are not strictly comparable [4]. That caveat is itself an important, underreported finding: EROI numbers quoted in popular discussion often come from studies using different system boundaries (well-head vs. delivered-to-consumer, direct-only vs. full lifecycle), and treating two such numbers as directly comparable is a common analytical error the original literature explicitly warns against [4].
Two more recent contributions show how the concept is now used at different levels of the same debate. A 2023 Nature Communications study models “systemwide EROI” across an entire power system transitioning toward net zero — an explicitly macro, scenario-based extension of the concept, estimating how the surplus-energy ratio of an entire national or regional grid might evolve as its generation mix changes over the coming decades [9]. That is squarely a scenario-modeling exercise, not a fact about the present system, and it inherits every caveat that applies to scenario modeling generally: it is conditional on the assumed buildout pathway. A 2024 Nature Energy methods paper, by contrast, goes back to the granular end of the problem, proposing improved calculation methods for EROI at the level of individual technologies and processes, arguing that inconsistent boundary-drawing across the existing literature has produced EROI estimates that vary enormously for what should be comparable systems [10]. Reading these two papers together makes the three-way comparison concrete: one paper is a systems model projecting an aggregate metric forward under assumptions; the other is a bottom-up methodological correction to how the underlying granular measurements should be taken in the first place. Both are legitimate, peer-reviewed, and answering different questions — and neither is a substitute for the historical question of how EROI actually shifted for coal-to-oil or oil-to-gas transitions, which requires the documentary reconstruction only environmental history supplies.
Where each approach’s failure mode shows up
Every one of the three traditions has a characteristic error it is prone to when used outside its native domain.
The macro-modeling failure mode is treating a scenario as a forecast. The IEA’s own framing — “possible energy futures” [1] — is explicit that its central cases are conditional, but scenario outputs are routinely quoted in public discussion as if they were point predictions, stripped of the assumptions that produced them. This is an analysis/scenario conflation, not a fact, and it deserves to be named as such every time a “the world will reach X by year Y” claim traces back to a scenario table rather than a realized measurement.
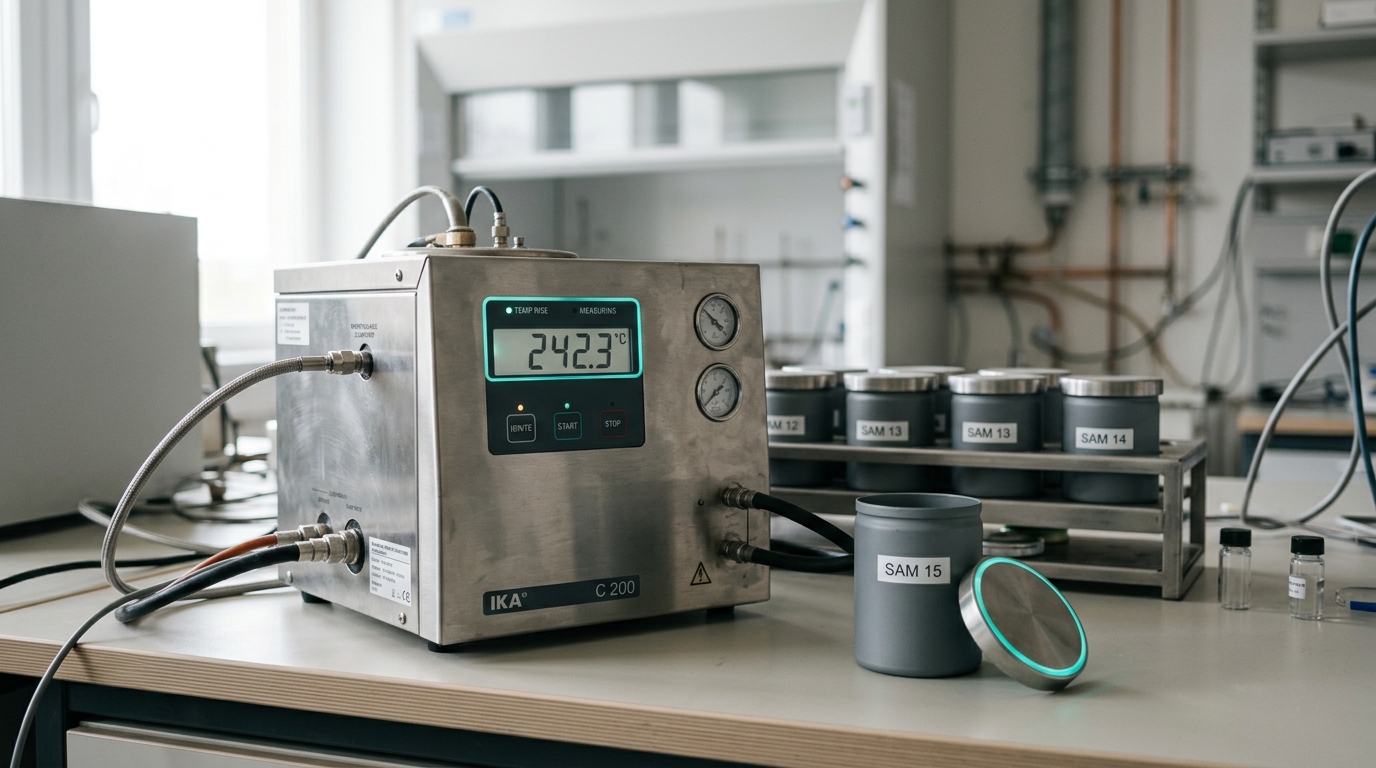
The grid-engineering failure mode is extrapolating a single component result to a whole system. A calorimeter reading on one transformer or an interconnection-queue delay at one substation is a real, verified fact about that unit — but a system operator or a journalist generalizing from a handful of site-level bottlenecks to a national claim about “the grid” is making an inferential leap the underlying data does not support without an explicit aggregation model, which reintroduces exactly the assumptions that macro modeling exists to make transparent.
The historical-case-study failure mode is assuming the past transition’s pace and conditions transfer unchanged to the present one. Fouquet is careful to note that the roughly-fifty-year average and thirty-year fastest case are institution- and technology-specific to the transitions actually observed, in a specific historical setting, with specific capital-stock turnover rates, regulatory environments, and information technologies [6] [7]. Citing “history shows transitions take decades” as a fixed law, rather than as a documented pattern under stated historical conditions that may or may not still hold, is the historical tradition’s own analysis/prediction conflation risk — treating a pattern as a mechanism-free constant rather than checking whether the mechanisms that produced the pattern (capital turnover, licensing regimes, the cost of new information) are still operating the same way now.
Reading the 2020s buildout through all three lenses at once
The current global buildout of solar, wind, storage, and grid-interconnection capacity is a case where all three traditions are being applied simultaneously, and the disagreements between them are informative rather than a sign that one of them is simply wrong.
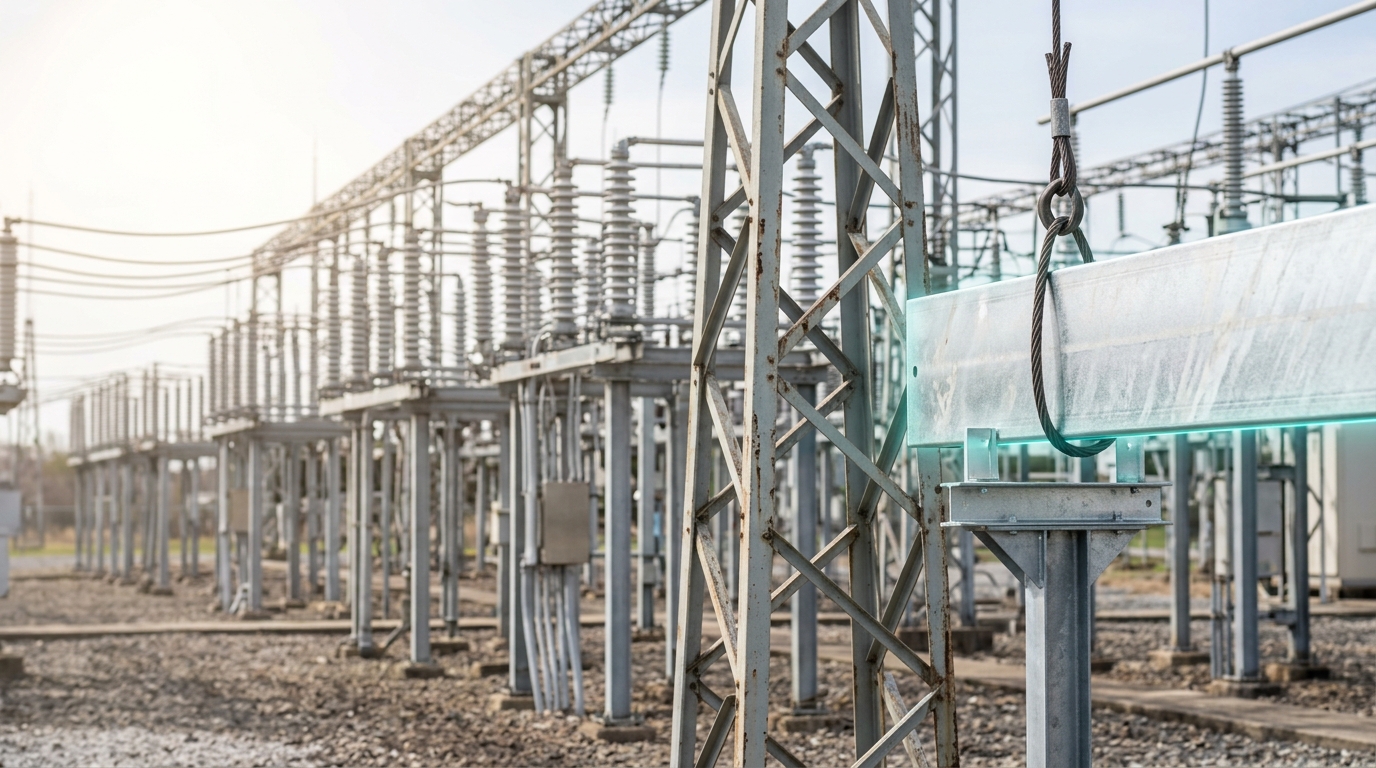
As a matter of recorded fact, energy agencies report substantial year-on-year growth in renewable generation capacity and in electricity’s share of final energy demand, and this is measured, realized data, not a projection [2] [3]. The IEA’s scenario work then extends this record forward under stated policy and technology-cost assumptions to produce its outlook trajectories — a distinct, conditional claim layered on top of the factual record [1]. Independently, grid-engineering analysis is surfacing site-specific constraints — interconnection-queue backlogs, transformer lead times, substation capacity limits — that are real, measured bottlenecks at the component level, but do not by themselves say what the national buildout curve will look like, because that requires aggregating thousands of such site-level facts against a model of how quickly bottlenecks get resolved. And the historical-transitions literature offers the outside disciplining check: a sector-specific transition in the past took, at the very fastest documented pace, on the order of three decades to move from a five percent to an eighty percent share [6]. A scenario or a set of engineering fixes that implies something categorically faster than any documented historical precedent is not automatically wrong — genuinely new institutional and technological conditions can change the achievable pace — but it is a claim that needs its supporting mechanism stated explicitly, not simply asserted by extrapolating a recent few years of growth.
None of this yields a ranking among the three approaches. The agency scenario tells a policymaker what a stated set of assumptions implies at a national scale over a policy-relevant horizon; it cannot tell an operator whether a specific substation will hold. The grid-engineering test cell tells the operator exactly that, with real measurement precision; it says nothing on its own about whether the national trajectory is achievable, because that requires an aggregation step outside the engineering method itself. The historical case study cannot forecast either the national trajectory or the single-substation outcome; what it supplies is the outside view — the empirical range of paces at which past transitions of this general kind have actually occurred, which is the only source of evidence for whether a given scenario’s implied pace is ordinary, unusually fast, or historically unprecedented.

Where expert disagreement is real, not a modeling artifact
Some disagreement across these traditions reflects genuinely unresolved questions rather than different tools measuring different things. The EROI methods literature itself documents an open, peer-reviewed disagreement about system boundaries — whether “energy delivered” should be measured well-head, at the power plant, or at the point of consumer use, and whether indirect energy costs (manufacturing the equipment, financing the operation) should be included at the same weight as direct fuel inputs [4] [10]. This is not a case where one lab has the right answer and the others are behind; different boundary choices answer different real questions (is this fuel a net energy source for a national grid? for a single plant? over its full manufacturing lifecycle?), and comparing numbers computed under different boundaries without adjustment is the error, not the existence of multiple boundary conventions.
Similarly, historians of energy transitions disagree with each other about how much of past transition pace was set by resource economics (relative fuel prices, extraction costs) versus institutional factors (capital-stock replacement cycles, regulatory permitting, information diffusion) — Fouquet’s own work traces both channels without resolving which dominated in any given historical case, because the documentary record supports attributing the outcome to a combination rather than to a single dominant cause [6] [7]. Presenting this as settled in either direction would overstate what the historical record actually shows.
A scenario, stated as a scenario
One conditional forecast worth stating explicitly, with its own falsification condition attached, following this article’s own rule against presenting scenarios as predictions: if interconnection-queue reforms and transformer-manufacturing capacity expansions currently being implemented in several major grids succeed in cutting typical interconnection wait times by half within the next ten years, then a national-scale electricity-generation transition compressed to roughly fifteen to twenty years — faster than the historical sector-specific average, though still within range of the fastest documented historical case — becomes a defensible central scenario rather than an outlier assumption. The observable indicators to track are publicly reported interconnection-queue lengths and transformer lead times (both already published by grid operators and industry associations), and the explicit disconfirmation condition is straightforward: if queue lengths and lead times are not measurably shorter within five years of such reforms being announced, the compressed-timeline scenario should be considered unsupported and the historical fifty-year average, or something closer to it, should be treated as the more credible base case.
What follows from holding all three at once
The practical upshot is not that one of these three research traditions should be trusted over the others, but that a claim about energy and infrastructure carries an implicit label indicating which tradition produced it, and that label determines what the claim can and cannot license. A macro energy-agency figure licenses a policy-relevant statement about national or global aggregates over a multi-year horizon, conditional on stated assumptions. A grid-engineering measurement licenses a precise statement about one physical system’s present capacity and near-term limits, and nothing beyond that scope without an explicit aggregation argument. A historical case study licenses a statement about the empirical range of paces and mechanisms actually observed in comparable past transitions, and a corresponding caution against assuming an unprecedented pace without an equally explicit account of what has changed. Energy and infrastructure sit at the intersection of all three time horizons, and treating any one of them as sufficient on its own is how confident-sounding claims about the future of energy systems end up being wrong for reasons the original source could have flagged, had it stated which of the three questions it was actually answering.