Four rooms, not one forecast
Inference economics do not have a single future, because they depend on four things that do not have to move together: how fast per-token prices converge across competing providers, whether the biggest providers retain pricing power despite that convergence, how much of the world’s inference workload ends up running on infrastructure nobody rents by the token at all, and whether the industry’s capacity to serve keeps pace with the industry’s willingness to ask for more of it. This article names four scenarios built from those four questions, gives each one a horizon, states what each assumes, names indicators that would tell a reader which one is happening, and states in advance what would prove it wrong.
None of the four is a prediction of what “AI inference” becomes as a single monolith. They are four different claims about which regime holds the majority of the world’s inference spend and inference traffic by 2035, and the honest starting position is that elements of more than one could be true in different market segments at once — commodity chat completions and premium frontier reasoning do not have to converge on the same regime, even inside a single provider’s own product line. Throughout, five kinds of statement are kept separate, exactly as elsewhere in this series. A fact is something disclosed in a financial filing, a benchmark result, or a provider’s own documentation. A vendor claim is a company’s statement about its own product, reported as a claim because the company has a stake in the answer. Analysis works out a consequence of stated facts. A scenario is one internally consistent way the future could go, presented beside its alternatives rather than as the likely one. A prediction commits to a horizon, states its assumptions, names an observable indicator, and states in advance what would disconfirm it.
This series’ opening piece worked through the mechanics of a single request’s bill — prefill against decode, cache reads against cache writes, reasoning tokens billed at the output rate and never returned in a visible response — and closed with four dated predictions running to August 2028 about reasoning-token disclosure, long-context pricing divergence, cache-discount stability, and the gap between price-per-token and price-per-completed-task. This article picks up those same objects — the meter, the tariff, the occupancy of a shared machine — and asks where a further decade of their operation plausibly leaves the industry: not at the level of one company’s rate card, but at the level of who ends up serving the world’s inference, at what margin, and under what constraint.
The documented present
The trajectory this article extends is unusually well documented for a market barely three years past its first public API price list, and four kinds of evidence — provider pricing archives, systems benchmarks, financial filings, and energy data — converge on a small number of facts worth stating plainly before any scenario is built on top of them.
Prices per unit of capability have fallen fast and unevenly. Epoch AI’s cross-benchmark analysis found that the price to reach GPT-4’s performance on a set of PhD-level science questions fell by roughly 40 times per year, with the rate of decline across the benchmarks studied ranging from ninefold to nine-hundredfold per year — and the authors added their own caveat that the fastest declines occurred in the most recent year studied and might not persist [2]. Andreessen Horowitz’s parallel tracking, which it calls LLMflation, put the decline at roughly tenfold per year measured at constant capability over the three years to late 2024, citing six separate contributing causes: hardware improvement, model quantization, software-level serving optimization, smaller models trained to match larger ones, post-training technique, and price competition from open-weight releases compressing margins across the value chain [3]. Both trackers are measuring the same underlying phenomenon from different angles, and the caveat in the first is a caution this article inherits throughout: fast recent declines are not guaranteed to be the steady-state rate.
That the decline is uneven rather than smooth is visible in a single month of production telemetry. Vercel’s AI Gateway — a routing layer that logs real request volume and spend across many customers and providers, rather than reporting any single vendor’s own numbers — found that open-weight models ran 29% of gateway tokens in June 2026, up from 11% in April, while accounting for under 4% of total spend; DeepSeek alone reached 22.6% of token volume. In the same month the blended price per token across the gateway was flat, but only because a roughly 12% rise in closed-weight frontier prices offset the effect of cheaper open-weight volume growing underneath it [4]. Aggregate price-per-token, in other words, is compatible with two very different stories happening at once — commoditization at the bottom of the market and firming prices at the top — and a single blended number erases the distinction between them.

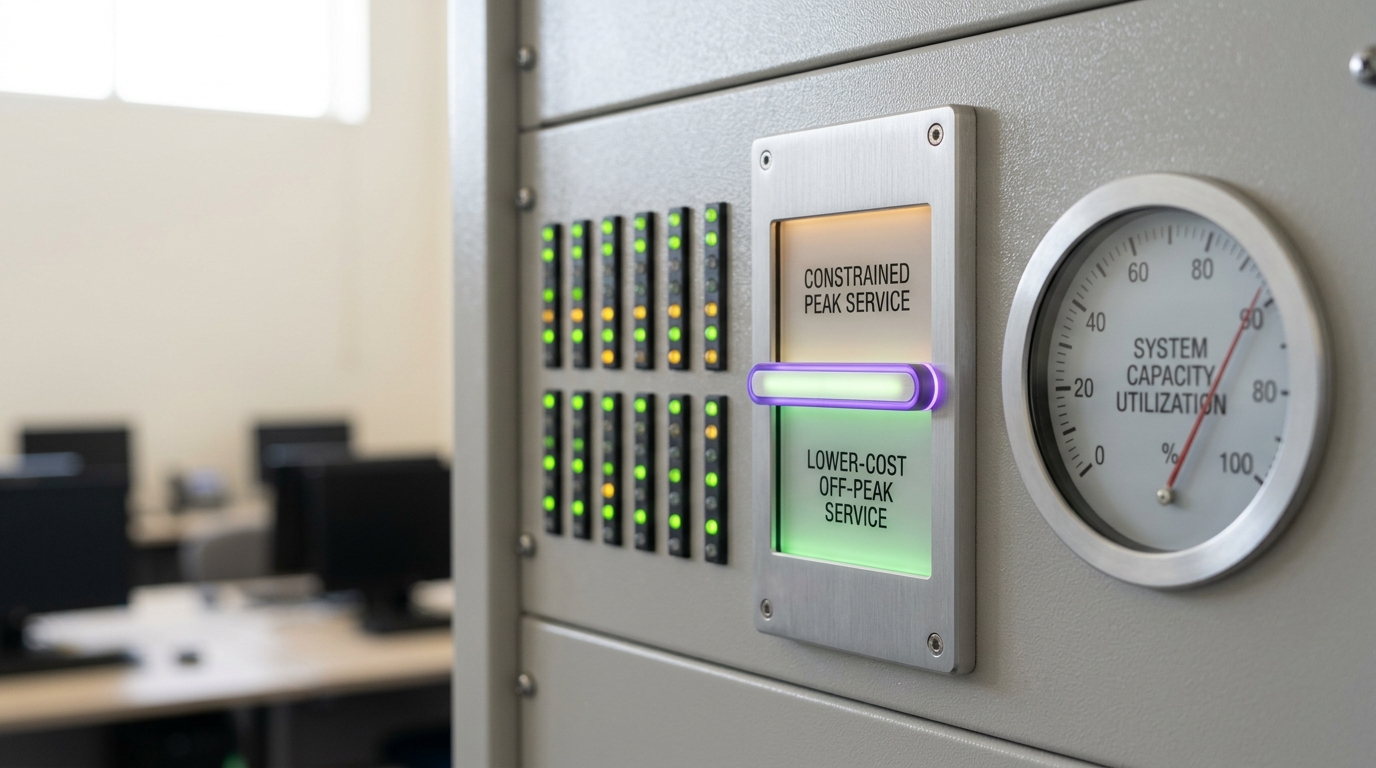
Two live pricing events, both dated within the same week this article was written, illustrate both directions at once. On 6 August 2026, DeepSeek — whose flagship model accounts for a large share of the open-weight volume described above — warned developers that a “significant” price increase was coming, attributing it to demand for its ultra-cheap DeepSeek-V4-Flash-0731 model that had overwhelmed available serving capacity within a week of release [6]. The new schedule took effect at 16:00 UTC on 16 August 2026: a peak/off-peak structure with off-peak rates at half of peak, peak hours confined to two narrow UTC windows [5]. In the other direction, Anthropic’s own pricing documentation confirms that the introductory two-and-ten-dollar-per-million-token rate for Claude Sonnet 5, originally scheduled to revert to three and fifteen dollars on 1 September 2026, will now remain the standard price instead; the increase “will not occur” [15]. OpenAI’s current rate card shows the same commercial instrument in a third guise: its flagship gpt-5.6-sol model prices long-context requests, a context-length tier rather than a currency or tokenizer change, at exactly double the standard input, cached-input and output rates [16] — the kind of tiered structure this series’ opening piece noted only one provider using at the time. In the same seven-day window, one major provider raised prices because it could not serve the demand its low price attracted, a second cancelled a scheduled increase evidently under competitive pressure, and a third’s rate card shows a durable tiered-pricing instrument doing quiet, permanent work. All three are documented; none is more representative of “the trend” than the others.
Provider gross margins on the hardware side remain high but are moving, and financial filings show both the direction and a candidate reason. NVIDIA’s fiscal 2026 GAAP gross margin was 71.1%, down from 75.0% in fiscal 2025, though it recovered to 75.0% in the fourth quarter alone; the company’s data center segment posted record full-year revenue of $193.7 billion, up 68% year over year [7]. The full-year compression, distinct from the quarterly recovery, is consistent with — though not proof of — competitive and product-mix pressure reaching even the hardware layer while volume keeps climbing regardless. Upstream of the chip, the capital committed to serving capacity keeps accelerating: Microsoft’s capital expenditures reached $115.9 billion for fiscal 2026, with Azure crossing $100 billion in annual revenue for the first time [8]; Amazon’s property-and-equipment purchases rose by $66.1 billion year over year on AI investment, while AWS’s operating margin expanded to 39.4% on operating income of $16.6 billion for the quarter [9]. Amazon’s own filing also discloses non-operating pre-tax income of $53.4 billion in the same quarter, “primarily from our investments in Anthropic” [9] — a concrete instance of the capital ties binding a hyperscaler distributor to a specific model lab, worth stating as a fact distinct from any claim about what it implies for market structure.
On the demand side, documents reviewed by the technology newsletter Where’s Your Ed At, attributed to OpenAI, show inference spend on Microsoft Azure of $3.77 billion in calendar 2024 and a further $8.67 billion through the first three quarters of 2025 [11]. These are reported figures rather than an audited public disclosure, since OpenAI is privately held, and this article treats them as reporting rather than settled fact; the publication states the numbers came from documents cross-referenced against other outlets’ reporting. Whatever the precise figure, the direction is not seriously contested elsewhere: inference spend at frontier labs is growing fast enough to be a governing constraint on strategy, not a rounding error against training cost.
And under all of it sits a physical constraint that neither a pricing team nor a procurement team controls. The International Energy Agency reports that electricity demand from data centres rose 17% in 2025, with AI-focused data centres alone surging 50%, and forecasts total data-centre electricity consumption roughly doubling from 485 terawatt-hours in 2025 to 950 terawatt-hours in 2030, with AI-focused consumption within that total nearly tripling over the same period. The same report documents grid-connection delays already pushing developers toward onsite gas generation, a shortage of high-bandwidth memory expected to persist through at least the end of 2027, and a 70% surge in gas turbine orders in 2025 [10]. Every scenario below has to be read against this constraint.
Four scenarios, not one forecast
The evidence above supports more than one storyline continuing at once, which is exactly why a single forecast is the wrong shape for this question. What follows are four scenarios, each a claim about which regime plausibly holds the majority of the world’s inference spend and traffic by 2035. They are not mutually exclusive by construction — a market can commoditize at the bottom while consolidating at the top, and self-hosting and a demand shock can coexist with either — but each is written as its own internally consistent claim, with its own horizon, assumptions, indicators, and disconfirmation condition, so a reader in 2035 has something concrete to check against what actually happened.
Scenario one: Commoditized Inference
The claim. By 2035, per-token prices for a given level of measured capability have converged tightly across at least three independent providers, tracking close to the hardware-and-energy marginal cost of serving a request rather than any individual provider’s cost-plus margin. Model quality differentiation persists at the frontier, but the bulk of volume — the high-frequency, latency-tolerant, non-frontier work that makes up most tokens actually billed — is priced within a narrow band regardless of vendor, the way commodity cloud compute or bandwidth is priced today.
Why this is the default extrapolation of the present. It is the straight-line continuation of the price-decline data above: roughly tenfold-per-year deflation at constant capability by one tracker’s measure since 2021 [3], a production gateway already showing open-weight models capturing 29% of real traffic on under 4% of spend [4], and Anthropic’s own decision to let a scheduled price increase lapse rather than execute it in a competitive market [15]. Systems research supports the underlying mechanism: chunked-prefill scheduling, phase-disaggregated serving, and prefix-tree caching have each demonstrated multi-fold throughput or latency gains on identical hardware over the systems they replaced, in this series’ opening piece, and none of those gains has stopped compounding.
Assumptions. This scenario assumes that model quality at the “good enough for most tasks” tier keeps converging across vendors, so buyers can actually switch on price without a real capability penalty, and that open-weight releases keep arriving close behind the closed frontier rather than that gap widening again. It also assumes accelerator supply eventually loosens enough that hardware scarcity stops propping prices up — which, given today’s high-bandwidth-memory shortage projected through 2027 [10], is a genuinely open question rather than a settled premise.
Indicators. The blended price-per-token across independent gateway telemetry (not any single vendor’s own numbers) narrowing in variance across providers at a fixed capability tier; the closed-weight/open-weight price gap documented in production data [4] continuing to compress rather than diverge; providers publicly declining to execute previously scheduled increases, as Anthropic did in August 2026 [15], becoming a repeated pattern rather than a single instance.
Horizon and disconfirmation. Horizon: end of 2032. Disconfirmed if, by then, the spread between the cheapest and most expensive providers’ prices at a matched, independently measured capability tier has not narrowed relative to its 2026 spread, or if closed-weight frontier prices have resumed rising faster than open-weight prices fall for two consecutive years.
Scenario two: Sustained-Margin Oligopoly
The claim. By 2035, a small number of providers — plausibly three to five — retain durable pricing power over the majority of enterprise and consumer inference spend, not because their per-token hardware cost is lower, but because model quality gaps at the frontier, deep product integration, and switching costs keep buyers paying a premium well above the commodity floor described in scenario one. Gross margins on inference stay materially above hardware cost of goods for the leading providers’ flagship tiers, even as commodity tiers compress underneath them.
Why this is plausible against the same evidence. The same production telemetry that shows commoditization at the bottom also shows the opposite motion at the top: closed-weight frontier prices rose roughly 12% in a single month even as open-weight volume grew underneath them [4]. Google’s own pricing page already schedules a doubling of its Gemini Flash tier’s price on 1 January 2027 — from $0.75/$3.75 to $1.50/$7.50 per million input/output tokens — a scheduled increase with no offsetting technical event disclosed, the same kind of purely commercial tariff instrument this series’ opening piece identified [17]. And the capital structure of the industry reinforces concentration mechanically: Amazon’s $53.4 billion in non-operating income tied to its Anthropic investment in a single quarter [9] is a direct financial stake by a hyperscaler distributor in one specific model lab’s success, of a kind that does not exist between a cloud provider and an interchangeable commodity good. NVIDIA’s hardware-layer margin holding near 70-75% even amid its fiscal 2026 dip [7] is a further, upstream proxy for how much pricing power persists in this stack even where volume is enormous and competition is real.
Assumptions. This scenario assumes frontier capability continues to matter enough, for enough of the highest-value work — complex agentic tasks, regulated domains, safety-critical applications — that buyers cannot fully substitute a cheaper model without a real quality loss, an assumption this article does not independently verify, since cross-vendor benchmark comparability is contested territory this publication treats skeptically elsewhere. It also assumes hyperscaler capital ties to specific labs continue functioning as effective distribution moats rather than being unwound by antitrust action or a simple commercial preference for multi-vendor sourcing.
Indicators. Continued gross-margin disclosure at or above current levels from providers who disclose them; further scheduled, not cost-triggered, price increases at the frontier tier following the pattern Gemini Flash’s rate card already shows [17]; continued or deepening capital investment by distribution-holding hyperscalers into specific model labs.
Horizon and disconfirmation. Horizon: end of 2032. Disconfirmed if the price premium of the top three providers’ flagship tiers over the cheapest credible open-weight alternative at matched capability has compressed by more than half relative to its 2026 level, or if at least two of the current hyperscaler-lab capital relationships have been unwound or diluted to a minority, non-exclusive stake.
Scenario three: Self-Hosting Majority
The claim. By 2035, a majority of the world’s inference volume, measured in tokens processed rather than dollars billed, runs on infrastructure the requesting organization owns or directly leases, rather than through a metered API call to a frontier lab — driven by open-weight models reaching quality parity with commercial APIs for most production workloads, and by accelerator cost curves making owned or reserved capacity cheaper than API rates at realistic utilization.
Why the mechanism is real, not just directionally plausible. The gating variable is utilization, and it has been directly measured rather than assumed. A 2026 methodology paper instrumenting live serving infrastructure found that identical H100 hardware produces effective costs ranging from $0.21 to $15.25 per million output tokens depending purely on offered request rate and the resulting concurrency — a 2.5-to-36-fold spread from utilization alone, with existing public cost calculators treating utilization as a fixed input rather than a measured one [13]. That is the same mechanism this series’ opening piece identified from the demand side, where concurrency was named the unpriced variable behind why short-context serving is cheap; this paper measures the identical mechanism from the supply side. A theoretical treatment of the companion trade-off — cost per token against serial generation speed, shaped by arithmetic, memory-bandwidth, and network constraints — separately notes that inference revenue at major AI companies has been growing at roughly threefold per year or more, which is the scale of demand growth any self-hosting decision has to plan capacity against [1]. An organization that can guarantee its own accelerators steady, high-concurrency load — which an API provider pools across many customers to achieve, but a single large enterprise workload can sometimes achieve on its own — closes a meaningful part of the gap against a metered API rate. Separately, a production-economics framework applied to real serving data documents diminishing marginal cost as inference scales and an identifiable cost-effectiveness optimum in configuration choice [14], which is the shape a self-hosting decision has to reason about explicitly, since an API buyer never sees it at all.

Assumptions. This scenario assumes the quality gap between the best open-weight models and the closed frontier keeps narrowing rather than widening — a trend visible in production telemetry (open-weight already at 29% of gateway token volume [4]) but not guaranteed to continue, since a single lab could pull ahead again with a step-change release. It also assumes the operational cost of running inference in-house — the engineering labour, the utilization discipline, the accelerator supply access — keeps falling in relative terms, a claim about tooling maturity this article cannot independently forecast.
Indicators. Published utilization-adjusted cost comparisons showing self-hosted inference beating provider API rates at realistic, not idealized, concurrency for a widening set of workload types; continued growth in open-weight models’ share of production gateway token volume, particularly outside the highest-value agentic and coding tiers where frontier quality still matters most [4]; growth in enterprise accelerator procurement and colocation specifically earmarked for inference rather than training.
Horizon and disconfirmation. Horizon: end of 2033. Disconfirmed if API-metered inference’s share of total measured inference token volume, across independently tracked gateways rather than one vendor’s own claim, is flat or rising relative to its 2026 level, or if the utilization-adjusted cost advantage of self-hosting fails to widen for any class of production workload over the period.
Scenario four: Demand-Elasticity Shock
The claim. By 2035, at least one major segment of the inference market has experienced a sustained price increase, not merely a pause in decline, because usage-based demand growth collided with a real, binding capacity constraint — accelerator supply, grid interconnection, or power availability — that providers could not build through fast enough, and the cost of that constraint was passed on rather than absorbed into margin.
Why this is not a hypothetical. It has already happened once, in miniature, in the week this article was written. DeepSeek’s ultra-cheap DeepSeek-V4-Flash-0731 model drew such explosive demand after its late-July 2026 release that the company’s own capacity was overwhelmed within days, forcing an August 6 warning of a coming “significant” price increase and a new peak/off-peak billing structure that took effect on 16 August 2026 [6, 5]. That is a demand-elasticity shock at the scale of one provider and one model generation. The scenario asks whether the same mechanism recurs at the scale of the whole industry, and the physical precondition is already documented: the IEA reports data-centre electricity demand up 17% in 2025, AI-focused facilities up 50%, grid-connection delays already pushing developers toward onsite gas generation as a workaround, and a high-bandwidth-memory shortage expected to persist through at least 2027 [10]. A capacity constraint that is already binding at the level of one hot model and one memory component is the same kind of constraint that, scaled up, could bind at the level of an entire market.
Assumptions. This scenario assumes electricity and accelerator supply growth continues to lag demand growth for a sustained period rather than catching up — the IEA’s own projected doubling of data-centre electricity consumption by 2030 [10] is compatible with either outcome, depending on whether supply-side buildout already booked in single-year capital commitments by Microsoft and Amazon [8, 9] keeps pace or falls behind. It also assumes providers choose to pass a binding constraint through as price rather than through non-price rationing such as queueing or quotas: DeepSeek chose price plus a time-of-day tier, but a different provider facing the same constraint could ration by access instead, which would not show up as a price signal at all.
Indicators. Multiple independent providers, not one, announcing price increases attributed explicitly to capacity or demand rather than to a currency, tokenizer, or feature change; growing use of time-of-day or peak/off-peak pricing structures, which is itself evidence a provider is managing a real physical constraint rather than a purely competitive one; continued or worsening grid-interconnection queue times and gas-turbine order backlogs in energy-sector reporting [10] running in parallel with rising, rather than falling, inference prices.
Horizon and disconfirmation. Horizon: end of 2031. Disconfirmed if no major provider, measured by token volume, executes a price increase explicitly attributed to demand or capacity constraint during the period, or if data-centre electricity and accelerator supply growth is reported as outpacing demand growth for the same period.
What the four scenarios share, and the question none of them settles
Read against each other, the four scenarios share more structure than their names suggest. All four take the token as the stable billing unit through 2035; none of them requires or predicts that the industry abandons per-token metering for something else, though a metering-unit change — to per-request, per-outcome, or per-second-of-reserved-compute pricing — is a real possibility this article has deliberately not built a fifth scenario around, because nothing in the sources behind this article gives it a documented trajectory the way the other four have. It is named here, in the same spirit as the discontinuity trajectory in this series’ companion piece on datacenter power and cooling, precisely because a genuine unit-of-account change would not be visible as a mature alternative in 2026 even if one were coming.
All four also inherit, unmodified, the caution this series’ opening piece raised about the gap between price-per-token and price-per-completed-task: reasoning tokens billed at the output rate and never returned in a visible response, and agent-loop context growth that compounds with trajectory length, mean that even a scenario where per-token prices fall sharply — scenario one — is fully compatible with total inference spend rising for buyers whose workloads are shifting toward longer reasoning and longer agent trajectories. A reader tracking only the headline per-token number, in any of the four scenarios, is tracking the least informative number in the transaction, the same conclusion this series reached about the present, now extended across the scenarios that describe its future.
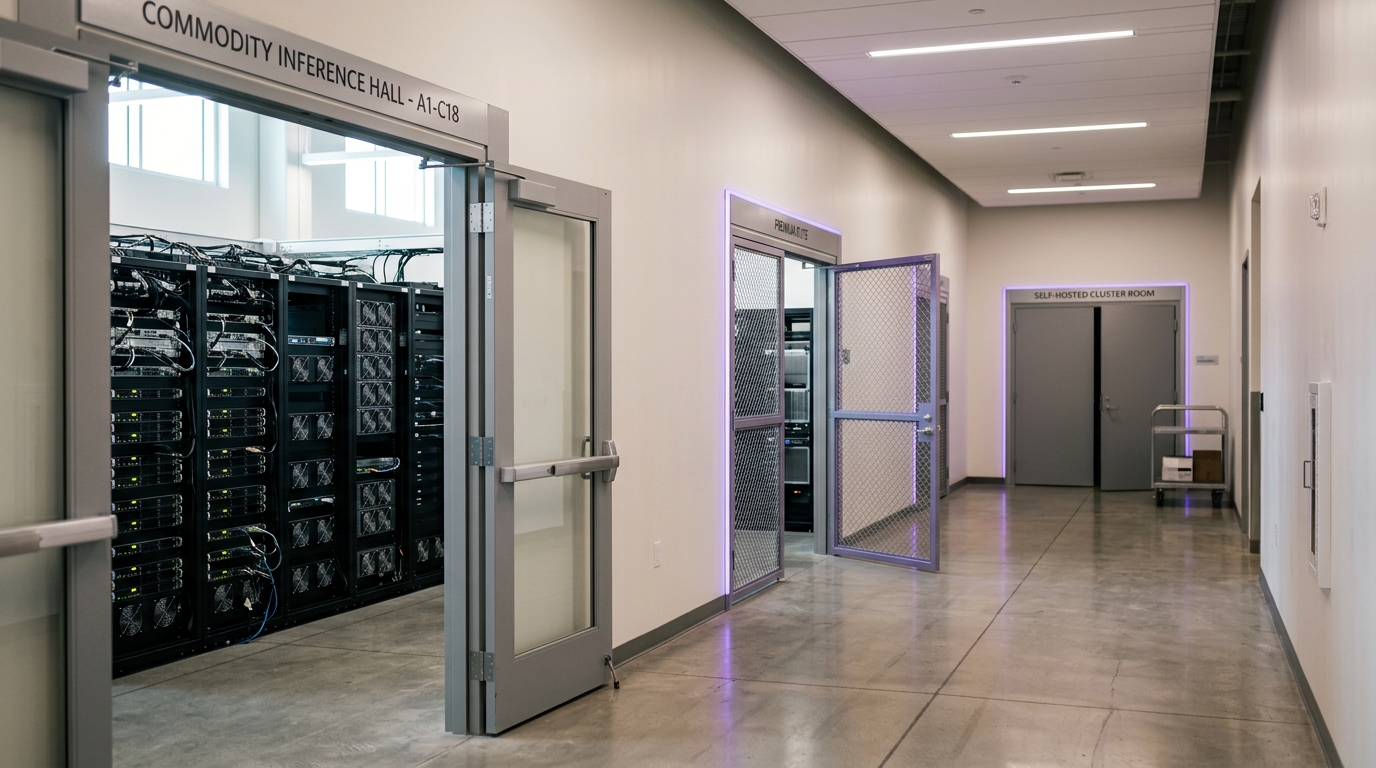
And all four are vulnerable to the same wildcard: an accelerator architecture or serving technique discontinuous enough with today’s stack that it resets the marginal-cost curve outside the range every trend line above was fit to. MLPerf’s own benchmark round already shows five new accelerator families submitting competitive results in a single cycle, with 27 organizations participating and the round explicitly framed around giving buyers “trustworthy, relevant performance data” for procurement decisions [12] — evidence the hardware layer is still moving fast enough that a genuine discontinuity, not just an incremental generation, remains live. None of the four scenarios above is built to survive that kind of shock; each assumes rough continuity of the broad hardware category even as it disagrees about pricing, structure, and constraint.
What to take away
None of these four scenarios is this article’s forecast. Each is a self-contained, falsifiable claim, and the evidence assembled above is genuinely compatible with more than one of them holding at once in different market segments — a plausible 2035 has commodity chat completions priced near marginal cost, a frontier reasoning tier still commanding real margin at three or four labs, a large and growing share of enterprise inference running on owned hardware for workloads where utilization can be guaranteed, and at least one bruising episode where a provider raised prices because it had run out of the thing it was selling.
What ties the four together is not which one wins but what a reader checking back in 2035 should actually look at: the spread between providers’ prices at matched, independently measured capability; whether that spread is closing or widening; whether frontier-tier margin holds against a compressing floor; the share of token volume running outside any metered API at all; and whether any major provider has raised prices explicitly because of capacity rather than currency, tokenizer, or competitive positioning. Every one of those five things is measurable now, from public disclosures, without waiting for 2035 to arrive. The discipline this article asks of that reader is the one this whole series asks: track the indicator, not the narrative, and notice which assumption behind each scenario turned out to be the one that mattered.