Sixty-Eight Days Was Long Enough to Ban a Pokémon, Not Long Enough to Solve One
Pokémon X and Y went on sale worldwide on October 12, 2013, and introduced Mega Evolution: a held stone that lets one Pokémon per team transform mid-battle into a stronger, sometimes retyped, form [6]. Kangaskhan’s stone gave it Parental Bond, an ability that makes nearly every attack it uses hit twice — the second strike at half power in the generation it debuted, a bonus judged strong enough that the very next generation cut it to a quarter power, where it has stayed since, and that Smogon’s own competitive dataset scores at 5 out of a possible 5 for the Generation 6 ruleset specifically, the maximum the scale allows [5]. On October 12, Mega Kangaskhan was a new toy on an untested ladder. On December 19 — sixty-eight days later — a single line change to the file that defines Smogon’s tier rules added one word to the OU banlist: Kangaskhanite [4]. It has not returned to that tier since.
Sixty-eight days is not long enough for a competitive population of any size to find, converge on, and exhaust a best response to a new strategy. It is barely one ranked season. Whatever correction happened to Mega Kangaskhan, it was not the metagame correcting itself — it was a standing committee reading the same evidence everyone else had and acting on it faster than any population process plausibly could. That fact is the hinge of this piece, and it is worth stating precisely before building anything, because the rest of this article spends its length on a different question: given a real, exact, and completely public payoff structure — Pokémon’s type chart — how much of what actually gets played can that structure alone explain, if you let it run to its own computed conclusion instead of asking a committee? The answer, computed against a real, dated slice of today’s ladder rather than assumed, is: rather less than the chart’s own admirers would guess, and rather more than “none” — which is a more interesting result than either extreme, and an honest one only if both halves are reported.
The Chart Itself Needs No Metaphor
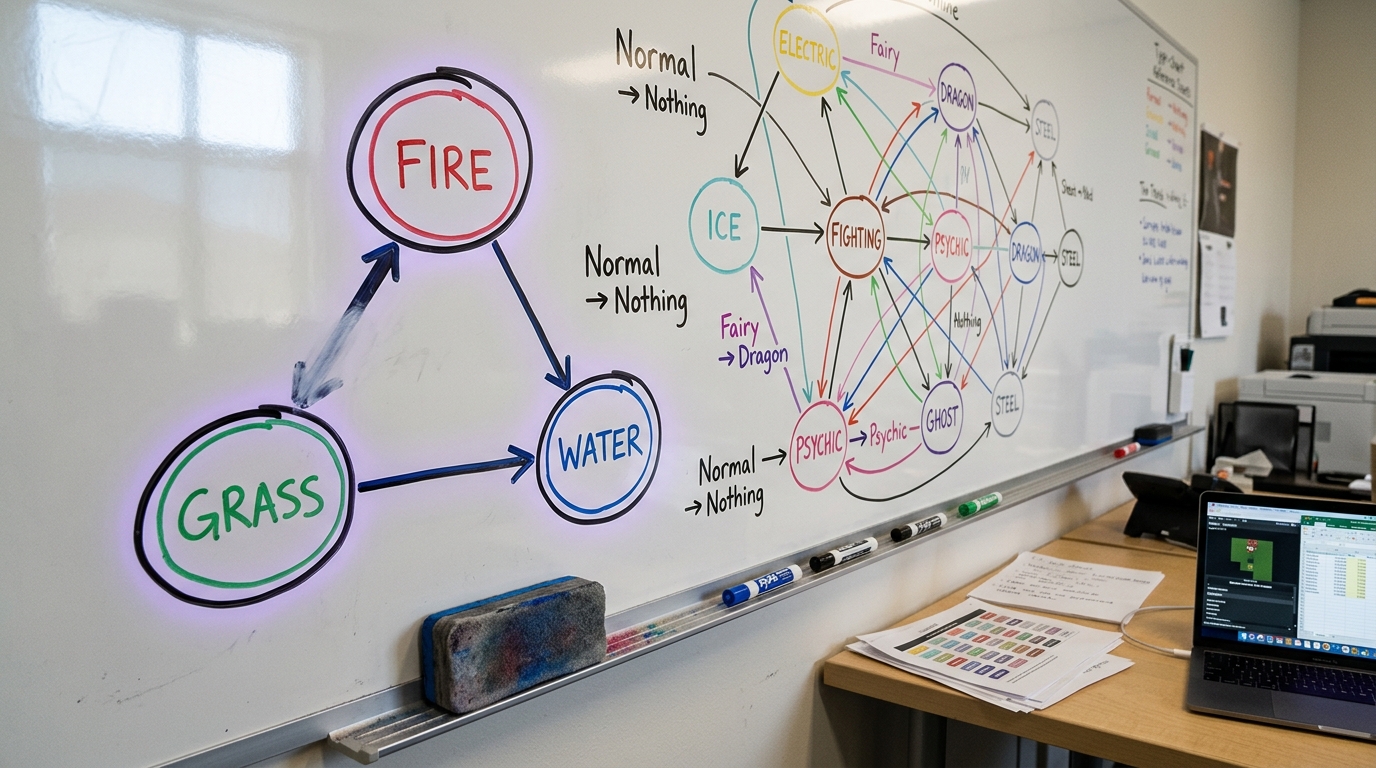
Most economics writing that reaches for a game outside economics is reaching for an analogy: markets are “like” an ecosystem, a firm is “like” an organism. The type chart does not need the hedge. Pokémon’s 18 types interact through a table of exactly three multipliers — 0, 0.5, or 2, with 1 as the unmarked default — published by the games themselves and unchanged in its current form since Generation VI: Fighting deals double damage to Steel and Dark, half to Flying and Fairy, none to Ghost; Ground deals double to Steel, Fire, and Electric, none to Flying; Dragon deals none to Fairy [1]. Every one of those numbers is a real payoff, in the literal game-theoretic sense: it tells a decision-maker exactly what a given choice returns against a given opposing choice, with no error term and no update over time. A payoff matrix that a game studio publishes and never quietly revises is a better empirical object than most matrices economists actually get to test theories against, and this article’s first commitment is to use it as one rather than as color.
That does not, on its own, make the matrix a complete description of the game. Two Pokémon of the same eighteen types can carry entirely different held items, abilities, move selections, base stat totals, and speeds — the type chart says nothing about any of that. So the honest way to ask what the chart alone explains is to build the smallest game it can support on its own terms — pure type-versus-type advantage, nothing else — solve that game exactly, and then check the solution against something the chart was never shown: what real players, on a real ladder, in a real dated month, actually did.
Building the Restricted Game From August 2026’s Actual Ladder
Smogon publishes usage statistics for every ranked format every month, tallying which species appeared on which teams across every logged ladder battle above a stated rating floor. The August 2026 file for Generation 9 OverUsed at the 1500-rating cutoff — 730,502 recorded battles — ranks Great Tusk first at 32.15% usage, followed by Gholdengo at 25.10%, Kingambit at 22.60%, Dragonite at 17.71%, Zamazenta at 17.69%, Ogerpon-Wellspring at 17.63%, Iron Valiant at 16.22%, and Raging Bolt at 15.55% [2]. Those eight are this piece’s restricted game — the highest-usage species in a real, named, dated tier, not a hand-picked or hypothetical roster.
Each carries an official dual typing, independently confirmed against the franchise’s own data rather than assumed: Great Tusk is Ground/Fighting [7], Gholdengo is Steel/Ghost [8], Kingambit is Dark/Steel [9], Dragonite is Dragon/Flying [10], Zamazenta’s Crowned Shield form — the one nearly every competitive set actually uses — is Fighting/Steel [11], Ogerpon’s Wellspring Mask form is Grass/Water [12], Iron Valiant is Fairy/Fighting [13], and Raging Bolt is Electric/Dragon [14].
Define each species’ offensive rating against another as the best same-type-attack-bonus multiplier its own types can produce against the target’s typing — the maximum, over its one or two types
Smogon actually publishes four parallel files for this same tier and month, cut at four different rating floors — 0, 1500, 1695, and 1825 — because a ladder pooling every account from a first-time entrant to a top-100 finisher answers a different question than one restricted to accounts that have already climbed past a stated skill line [2]. The 0-cutoff file counts every battle and is the closest thing to “what does the average player bring”; the 1825 file counts only the highest, thinnest slice of the ladder, where sample sizes shrink and any one strong player’s personal preferences can move a percentage point. This piece uses the 1500 cutoff deliberately, as Smogon’s own tiering discussions typically do: high enough to exclude a large mass of unranked and early-placement games that have not yet separated signal from noise, low enough to keep the battle count in the hundreds of thousands rather than the tens of thousands, so August’s 730,502 logged battles are a genuinely large sample rather than a boutique one.
Two entries make the shape of the resulting game concrete. Great Tusk’s Fighting-type attacks land at 2× on Kingambit’s Steel half and 2× again on its Dark half, for a combined 4× — the single strongest matchup among all 56 ordered pairs in this restricted game. Against Dragonite, by contrast, Great Tusk’s best option is Fighting into Dragon/Flying, and Flying halves Fighting damage while Dragon is neutral to it, so its best multiplier there is only 0.5× — Great Tusk’s single weakest matchup on this list. The chart is exact; it is not kind to any one species uniformly.

A Payoff Matrix Wants an Equilibrium, So Compute One
A matrix of pairwise advantages is an invitation to ask what a population that only cared about that matrix would converge on. Convert
Run the continuous replicator equation on the resulting eight-strategy zero-sum game:

The Real Ladder Refuses the Equilibrium It Was Handed
Comparing a model mix to real shares needs a stated test, decided before looking at the fit, and this piece uses two: a uniform mix across the eight species (12.5% each, the null of “typing conveys no information at all”) and a pure persistence model — July 2026’s usage shares for the same eight species, renormalized to sum to one, used with no type-chart term whatsoever as a prediction of August [3]. Renormalizing August’s own eight shares to sum to one as well gives the observed target: Great Tusk 19.53%, Gholdengo 15.24%, Kingambit 13.72%, Dragonite 10.76%, Zamazenta 10.74%, Ogerpon-Wellspring 10.71%, Iron Valiant 9.85%, Raging Bolt 9.45%.
| Species | Types | Aug. 2026 usage | Observed share (of these 8) | Solved-game share | Uniform | July share (momentum) |
|---|---|---|---|---|---|---|
| Great Tusk | Ground/Fighting | 32.15% | 19.53% | 87.71% | 12.50% | 20.28% |
| Gholdengo | Steel/Ghost | 25.10% | 15.24% | 0.03% | 12.50% | 15.21% |
| Kingambit | Dark/Steel | 22.60% | 13.72% | 5.76% | 12.50% | 13.64% |
| Dragonite | Dragon/Flying | 17.71% | 10.76% | 6.50% | 12.50% | 10.32% |
| Zamazenta | Fighting/Steel | 17.69% | 10.74% | ~0.00% | 12.50% | 10.13% |
| Ogerpon-Wellspring | Grass/Water | 17.63% | 10.71% | ~0.00% | 12.50% | 10.72% |
| Iron Valiant | Fairy/Fighting | 16.22% | 9.85% | ~0.00% | 12.50% | 10.16% |
| Raging Bolt | Electric/Dragon | 15.55% | 9.45% | ~0.00% | 12.50% | 9.53% |
Scoring the fit with Kullback–Leibler divergence,

By this piece’s own pre-stated kill criterion — the model should be believed only if the real distribution fits it at least as well as it fits both named nulls — the model fails, plainly and by orders of magnitude, and that failure is reported here rather than argued around. This is Derived, not Proposed: every number above follows mechanically from the chart, the usage files, and the stated formulas, and nothing about the fit was adjusted after the fact to look better or worse.
What the Failure Is Actually Measuring
The obvious objection is that this was never a fair fight. Real teams carry coverage moves well outside their own two types, items that swap resistances, abilities that void whole attacking types, speed tiers that decide who acts first, and — the largest omission — a legal pool of several hundred other ranked species this restricted game excludes entirely. A model built from nothing but dual-type STAB advantage among eight pre-selected species was never going to reproduce a real 758-species ladder, and treating its failure as a surprise would be dishonest about what was built.
But the direction and size of the failure are still real findings, not an excuse. The solved game does not fail randomly — it fails toward total concentration, because Great Tusk’s Ground/Fighting typing is close to strictly dominant against this particular field: neutral or better into six of the other seven, including that 4× spike into Kingambit, and weak into only Dragonite. A population governed by nothing but this payoff structure has every incentive to pile onto that one dominant strategy and stay there, and the replicator computation shows exactly how far that logic wants to go: 88%, not 32%. That the real ladder instead spreads its top eight across a 10-to-20% band is a measured statement about how much non-type machinery — movepools, items, abilities, speed, prediction, and a hard cap of six slots per team competing against team-building constraints the chart cannot see — is doing the work of keeping seven other approaches viable against the single best-typed answer in the field. The chart gets the direction right — Great Tusk topping the real ladder is not an accident the type math is blind to — while getting the magnitude wrong by nearly a full order of concentration. Proposed, and clearly labeled as this piece’s own reading rather than an established result: the type chart determines who has a case for being played, and everything the chart omits determines how evenly that case gets divided among the field that still has one.

The 5.76% the replicator computation still leaves Kingambit, rather than driving it fully to zero alongside Zamazenta, Ogerpon-Wellspring, Iron Valiant, and Raging Bolt, is itself informative about what a genuine equilibrium calculation is sensitive to. Kingambit answers two of the other seven at 2× — Gholdengo, via its Dark-type STAB hitting Ghost, and Iron Valiant, via its Steel-type STAB hitting Fairy — while being answered at 4× by both Great Tusk and Zamazenta. A “best type wins” story with no computation behind it would predict Kingambit gets crowded out entirely once a strictly better-typed rival exists; the replicator dynamics instead keep it alive at low but positive weight precisely because it still has real, if narrower, outs against two specific rivals, and a small population of Kingambit remains a viable minority strategy against a field otherwise dominated by Great Tusk and Dragonite. That is a genuine, checkable prediction of the model that happens to point the same direction as the real ladder, where Kingambit sits third at 22.60% — one of the few places the solved game’s internal structure, not just its headline winner, lines up with what actually gets played.
It is worth being precise about which institutional mechanism this piece has been testing against, because Smogon runs two, and they operate on different clocks. One is automatic and continuous: a species that falls below a stated usage-share threshold in its current tier — 4.52% for Generation 9, on Smogon’s own published rule — drops to the tier below without any suspect test or committee vote at all, a mechanism that responds directly to the same usage numbers this piece has been comparing against the solved game [15]. The other is exactly what happened to Kangaskhanite: discretionary, vote-based, and triggered when a strategy’s dominance is judged to be distorting the tier regardless of whether its raw usage number alone would have triggered an automatic drop. Every comparison in this piece has been against usage share, which the first mechanism tracks continuously; the ban that anchors its closing argument came from the second, deliberately human one — and conflating the two would understate how much of what actually happens to a Pokémon’s standing in its tier is procedural rather than computed from any payoff matrix at all.
That the persistence model — no game theory, no typing, just “whatever was popular last month is popular this month” — beat both the uniform null and the solved equilibrium by roughly two orders of magnitude in KL divergence is its own separate result, and arguably the more important one for how to think about “the metagame” at all. A real competitive population does not resolve to a freshly computed equilibrium every month; it carries an installed base of teams, familiarity, and community consensus forward with strong inertia, and August 2026’s ladder looks like August 2026’s ladder mostly because July 2026’s ladder looked almost exactly the same. This is a claim strictly about the top eight species over a single one-month step in one specific tier; it should not be read as a claim that Gen 9 OU or any other metagame never shifts — Ogerpon-Wellspring’s slide from fourth to sixth between the two months, while Dragonite moved up one place and Zamazenta moved up two, shows real month-to-month churn even inside a broadly stable order. Extending “persistence beats equilibrium” beyond this specific eight-species, one-step comparison to the full 758-species tier, to other formats, or across a longer horizon is Speculative, not Derived, and would need a rerun at larger scale before this piece’s specific numbers could be claimed to generalize; if a wider rerun found the type-chart equilibrium closing most of that gap once the full legal pool is included, this piece’s central “half-solves it” reading would need to narrow accordingly.
When the Model’s Correction Never Gets to Run
Return, now, to Kangaskhan, because it names the boundary this piece has been building toward rather than illustrating a separate point. If the type chart’s equilibrium logic actually governed outcomes, an overpowered strategy should erode on its own: opponents adapt, counter-picks rise in usage, the payoff matrix’s own dynamics eventually punish over-concentration the way this piece’s replicator computation punishes six of its eight species down toward zero. Mega Kangaskhan never got the chance to test that story either way. Sixty-eight days after Mega Evolution existed at all, a tiering council removed it by fiat, and the same item was independently re-banned from OU’s own Monotype variant five days after that and from the 1v1 format twenty-five days into the following month — three separate rulings within the mechanic’s first four months on record, all administrative, none a measured population response [4].

Even the administrative mechanism is not one clean, uniform process, which matters for how much weight to put on “a committee decides” as a tidy alternative to “the equilibrium decides.” The same Kangaskhanite that took sixty-eight days to be banned from Singles OU took until April 2017 — more than three years — to be banned from Doubles OU [4], a structurally different metagame with its own usage patterns, its own suspect-testing cadence, and evidently a much longer institutional patience for the same held item. Two formats, one payoff-relevant fact about one Pokémon, and two entirely different correction timescales — neither of which was computed from anything resembling this piece’s replicator equation.
That is the actual shape of “half-solves it,” stated plainly rather than as a hedge: Pokémon’s type chart is a real, exact, unmetaphorical payoff matrix, and solving it produces a real, checkable prediction — one this piece computed rather than assumed, and one the real ladder rejects by a wide, measured margin in favor of a model with no game theory in it at all. The chart is not decorative; it correctly flags which single species has the strongest structural case in a given field, which is more than a null model can do. But the gap between an 88% computed monopoly and a 20% real plurality is exactly the space occupied by everything the chart cannot price — team-building constraints, movepools, prediction, and, for the one case in this piece’s dataset where a strategy genuinely threatened to dominate, a standing committee that did not wait for any equilibrium to arrive before overruling it. A market or a metagame having a fully known, exactly specified payoff structure sitting in the open is not the same claim as that market or metagame actually resolving to what the structure computes — the same caution this house has already stated for real markets under the replicator model applies here without needing new machinery, just a new, real, and considerably more literal payoff matrix to test it against [16].