The line item nobody prices
Alignment and safety work is almost always argued about in technical or ethical registers: whether a reward model captures the right objective, whether a refusal is calibrated correctly, whether a red team found the right failure. It is far more rarely argued about in the register that actually decides how much of it happens — dollars, GPU-hours, and expert-hours, drawn from a budget that also funds the next pretraining run. That budget is finite, the three things this article prices are not free, and the choices made inside it are economic before they are anything else.
This piece assembles the documented cost structure of alignment and safety work at the scale frontier labs now operate, decomposed into three cost centres that map onto three distinct kinds of scarcity:
What a comparison costs, and who is paid to make it
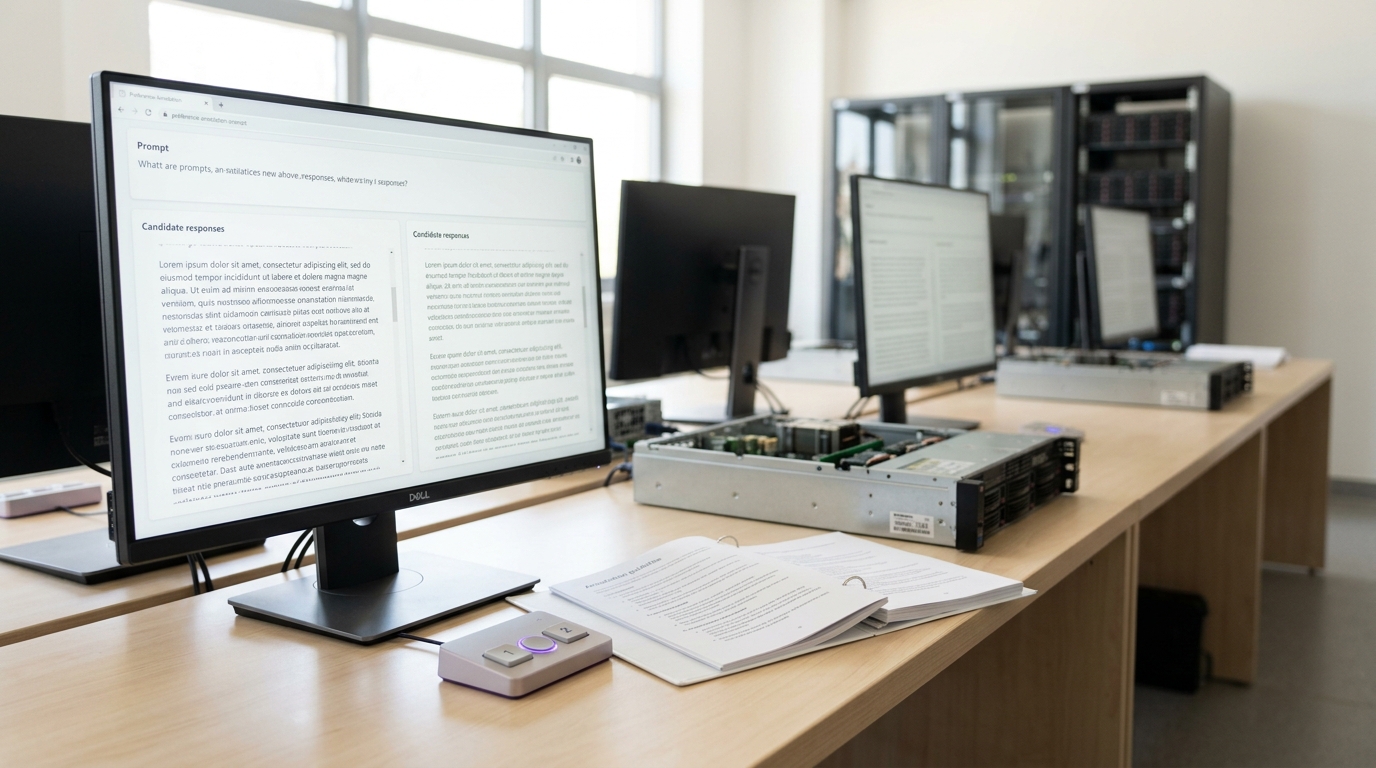
Every RLHF pipeline runs on a labelled dataset of demonstrations and pairwise comparisons, and every one of those labels was produced by someone, paid at some rate, at some volume. The clearest published account remains Ouyang and colleagues’ InstructGPT paper, which reports hiring a team of about forty contractors through Upwork and the vendor ScaleAI to write demonstrations and rank model outputs [1]. Forty people is a strikingly small number set against the scale of the systems this labour eventually shapes, and it illustrates the first fact about this cost centre: the headcount buying the preference signal for a frontier model has historically been in the tens, not the thousands.
Anthropic’s account of building a helpful-and-harmless assistant gives a second data point on the same question, and a warning about what a small headcount does to quality control. Their study collected more than 160,000 helpfulness and red-teaming comparisons across a base dataset, a rejection-sampling dataset, and an online dataset, recruiting workers principally through Amazon Mechanical Turk and Upwork [2]. Within that corpus, a review of worker contribution found that roughly twenty crowdworkers produced about eighty percent of the total comparisons collected. A preference model trained on that data is not an aggregate of a broad population’s judgement; it is disproportionately the judgement of a couple of dozen specific people, however carefully instructed. That concentration is a direct consequence of the economics — recruiting, vetting, and retaining a rater who reliably agrees with your quality bar is expensive enough that it is cheaper to give the good ones more hours than to recruit more people to a lower bar.
Wage rates vary by an order of magnitude or more across this labour market, and the variance is itself documented rather than inferred. At the low end, TIME’s investigation into a content-moderation labelling contract found that OpenAI’s outsourcing partner Sama paid Kenyan data labellers a base salary of 21,000 Kenyan shillings a month, about 170 US dollars, with take-home pay running between roughly 1.32 and 2.00 US dollars an hour depending on seniority and whether performance targets were met [4]. That specific contract was for a toxic-content classifier rather than RLHF preference comparisons proper — a separate but adjacent labelling task in the same broad category of human safety-data work — and workers reported being expected to read and label between 150 and 250 passages of graphic text per nine-hour shift, a volume Sama disputed, putting the figure closer to seventy. OpenAI’s total contract value with Sama for this work was reported at about 200,000 US dollars, reduced to about 150,000 US dollars after the relationship ended early [4]. At the higher end of the same broad labour market, Anthropic’s red-teaming study paid Upwork participants 20 US dollars an hour and Mechanical Turk participants between 7.50 and 9.50 US dollars per completed set of five conversations — a rate the researchers checked against completion speed and found sat at or above California’s minimum wage [5]. The same general kind of task, labelling text against a safety-relevant rubric, is priced anywhere from under two US dollars an hour to twenty, depending on jurisdiction, platform, and how specialised the judgement required actually is.

The arithmetic of a label, and its ceiling
The unit economics matter because a dataset’s cost is close to linear in its size:
with
That ceiling on
What the training run itself costs, against pretraining
The second cost centre is the compute spent training a policy against the collected feedback, and here the documented history shows the sharpest movement over time. Ouyang and colleagues report the compute cost of InstructGPT’s post-training pipeline in the same units used for GPT-3 itself: supervised fine-tuning of the 175-billion-parameter model cost about 4.9 petaflops per second-days, and the main PPO-ptx reinforcement learning run cost about 60 petaflops per second-days, against 3,640 petaflops per second-days to pretrain GPT-3 [1]. Combined, the alignment-specific training in that pipeline came to roughly 1.8 percent of the pretraining compute it was built on top of — a genuinely small fraction, and one of the few places a lab has published the two numbers side by side in comparable units.
That fraction has moved substantially since 2022. DeepSeek’s R1 model provides the clearest recent public case, because both its pretraining and its reinforcement learning phase were disclosed in enough technical detail for an independent estimate to be built. Epoch AI’s own reconstruction puts DeepSeek-V3’s pretraining at about 5.3 million US dollars, based on 2,048 H800 GPUs run at roughly 2 US dollars per GPU-hour over the reported training schedule, and the initial R1-Zero reinforcement learning phase at about 1 million US dollars, assuming similar hardware utilisation to the pretraining run [11]. That is roughly seventeen to twenty percent of the pretraining figure — an order of magnitude larger a share than InstructGPT’s, and it is worth being precise that this is an independent analyst’s estimate resting on assumed GPU pricing and utilisation, not a cost figure DeepSeek itself disclosed.
Two data points three years apart,

The throughput limit on red-teaming
The third cost centre is adversarial testing, and it is the one where the physical limit is most visible, because the output being purchased is not a dataset but a discovery, and discoveries get harder to make as the target improves.
Anthropic’s early red-teaming study gives the most granular public account of this labour market. The team recruited 324 crowdworkers, 307 through Mechanical Turk and 17 through Upwork, and collected 38,961 red-team attacks across model variants, with roughly 11,000 attacks logged against most model types [5]. Productivity was as concentrated as the labelling data above: about eighty percent of all attacks came from about fifty of the roughly three hundred workers. The paper’s central scaling finding is the one that matters most for this article’s argument — models trained with RLHF became significantly harder to red-team as they grew larger, while plain language models, prompted models, and rejection-sampling models showed a flat trend with scale [5]. Put in economic terms, if a single red-team attempt costs
Holding
Specialised domains push the same limit further, because the pool of qualified testers shrinks as the domain narrows. OpenAI’s GPT-4 system card documents recruiting more than fifty external experts beginning in August 2022, across domains including cybersecurity, biorisk, chemistry, nuclear risk, disinformation, and international security, feeding into internal adversarial testing of the launch version conducted in March 2023 — on the order of seven months of work to cover roughly a dozen named domains [6]. Anthropic’s account of testing one narrow slice of that surface — whether a model could meaningfully assist a biological attack — describes spending more than 150 hours over six months with expert collaborators on that single domain, and states more generally that subject-matter and model experts together typically need on the order of 100 or more hours to probe one capability area with any confidence [7]. Fifty experts across roughly a dozen domains over seven months, and 150 hours to cover one domain thoroughly, are both real, funded, documented efforts — and both describe covering a small fraction of what a genuinely exhaustive map of domains, languages, modalities, and deployment contexts would require.

A useful, explicitly illustrative way to see the size of that gap is to price coverage directly as a scenario, not a reported figure:
the cost of testing
The DEF CON 31 AI Village Generative Red Team Challenge shows the alternative approach, and its own limit. The event drew about 2,200 participants attacking eight large language models from six vendors, with average submitted conversations running 10.29 turns and the shorter, successful submissions averaging 8.68 turns [8]. A test run held ahead of the main event at Howard University generated about 10,000 model outputs in a single hour, from which only a few hundred submissions were actually made [8]. Crowd scale buys raw attempts cheaply — thousands of participants, tens of thousands of generations — but the conversion from attempts to genuinely useful findings still passes through the same bottleneck as the smaller expert programmes: someone has to judge which of the attempts actually matters, and that judgement, not the attempt volume, is what is scarce.
Where this competes with capability, specifically
Set against these figures, the scale of the capability budget makes the comparison stark and also clarifies exactly where the real competition sits. Epoch AI’s analysis of frontier training costs finds that the cost of training the most capable models has grown by a factor of two to three every year for eight years running, on a trajectory that puts a single frontier training run over a billion US dollars by 2027, with hardware accounting for 47 to 67 percent of that cost, R&D staff for 29 to 49 percent, and energy for a comparatively small 2 to 6 percent [9]. Notably, that same analysis does not separately break out post-training or fine-tuning cost from the pretraining figure it reports — the accounting convention itself treats alignment-adjacent training as absorbed into the total rather than itemised, which is one more way the true alignment share of a lab’s compute budget stays unobserved from outside.

The naive framing of the tradeoff — alignment spending against the pretraining budget — is misleading given the numbers above, because the RLHF and RLAIF share of a training programme, even generously estimated at DeepSeek-R1’s roughly one-fifth ratio, remains a modest slice of a pretraining figure heading toward ten figures. The sharper and more accurate framing is that alignment training now competes against capability-focused post-training specifically, inside the same budget line, on the same clusters, often run by overlapping teams. Epoch’s finding that reasoning-focused post-training compute is scaling roughly tenfold every four months describes a budget line growing so fast that it will soon be constrained by the same total-compute ceiling as pretraining itself [10]. Every GPU-hour a lab commits to RLHF, RLAIF, or the reward-model training that supports either is a GPU-hour not committed to the reasoning RL runs currently driving the most measurable capability gains per dollar. That is a real, current, and — because neither side of it is separately disclosed — largely invisible tradeoff, and it is the one the evidence in this article actually supports, rather than the more familiar but weaker claim that safety loses out to pretraining scale.
Predictions, with the observations that would falsify them
These are forecasts, clearly separated from the sourced analysis above. Horizon: August 2029.
One. As reasoning-focused post-training compute keeps growing relative to pretraining, at least one major lab will begin publicly itemising the safety-specific share of its post-training compute, distinct from capability-focused reasoning RL, because the current combined disclosure will have become uninformative to regulators and customers alike. Disconfirmed if leading labs in 2029 still report only combined post-training figures with no safety-specific breakdown.
Two. The dollar cost per human preference comparison will keep falling as AI-assisted and AI-generated feedback substitute further for pure human labelling, narrowing rather than closing the gap documented here, because verified human judgement will remain the calibration anchor AI feedback is checked against. Disconfirmed if published preference datasets in 2029 rely on AI-generated labels with no accompanying human-calibration sample.
Three. Red-teaming coverage will be reported increasingly as an explicit ratio — domains or capability areas tested against a stated threat-model total — rather than as a raw expert-hour or headcount figure, because headcount figures like fifty experts will have become uninformative once attack surfaces are understood to be combinatorial. Disconfirmed if system cards in 2029 still report red-teaming scale purely as participant counts with no denominator.
Four. The rate of growth in reasoning-focused post-training compute will slow measurably within roughly a year of this article, consistent with Epoch’s own prediction, and the deceleration will be visible first as a narrowing gap between successive frontier models’ reported post-training compute rather than as an announced policy change. Disconfirmed if post-training compute continues scaling at a sustained tenfold-per-four-months pace through 2028 without a published resource constraint being cited.
What to take away
Every documented figure in this article is small compared to the systems it is meant to check, and that is close to the whole argument. A team of forty contractors built the preference data behind InstructGPT. A reinforcement learning run costing under two percent of pretraining compute produced a model people preferred over one a hundred times its size. Fifty experts across a dozen domains, and a few hundred crowdworkers paid by the conversation, are what documented red-teaming programmes have actually looked like. None of these numbers is a failure by the people who spent them — they are what was funded, and in several documented cases they produced real, measurable safety gains. The point of pricing them is narrower: alignment and safety work draws from the same finite pool of dollars, GPU-hours, and qualified specialists that capability work draws from, the competition is sharpest against the fastest-growing part of that pool rather than against pretraining itself, and a number nobody publishes is a number nobody outside the lab can hold anyone accountable to.