Every provider quotes inference in the same unit: a price per million tokens, split between input and output. That single number reads like a cost — as if a token had an intrinsic price the way a kilowatt-hour does. It does not. A token’s price is the output of a serving system with several independently-tunable knobs, and the distance between what that system actually costs to run and what it is billed at is exactly the margin. This article is a walkthrough of those knobs — batching, caching, routing, and the utilization and energy accounting underneath them — using published serving-systems research and the pricing disclosures providers have made public, rather than an attempt to reverse-engineer any one company’s income statement.
The unit that actually gets billed is not the unit that costs money
A large language model generates tokens one at a time, and each new token requires a forward pass through the whole network conditioned on every token that came before it. The expensive resource is not “compute” in the abstract; it is GPU time and GPU memory bandwidth, and the two are not spent evenly across a request’s lifetime.
Serving systems split a request into two phases with very different resource profiles, a distinction formalized in the Splitwise paper: a prefill phase, where the full prompt is processed in one pass and the workload is compute-bound, and a decode phase, where output tokens are generated one at a time and the workload is memory-bandwidth-bound, because each step must read the entire growing key-value (KV) cache back from memory to produce a single new token [4]. This matters for pricing because most providers charge a different rate for input tokens than for output tokens — the OpenAI pricing page lists output tokens at roughly four times the price of standard input tokens for a comparable model — and that ratio approximately tracks the difference in how expensive the two phases are to run, not some vendor’s arbitrary choice [5]. (Fact, sourced to the cited pricing page and paper.)
Batching: selling the sliver of GPU time that would otherwise be wasted
A single request generating one token at a time badly under-uses a modern accelerator. The GPU has enormous parallel throughput sitting idle while it waits on memory reads for one user’s next token. The obvious fix — process many requests’ forward passes together as one batch — runs into a scheduling problem: requests do not arrive together, and they do not finish together, because they generate different numbers of tokens.
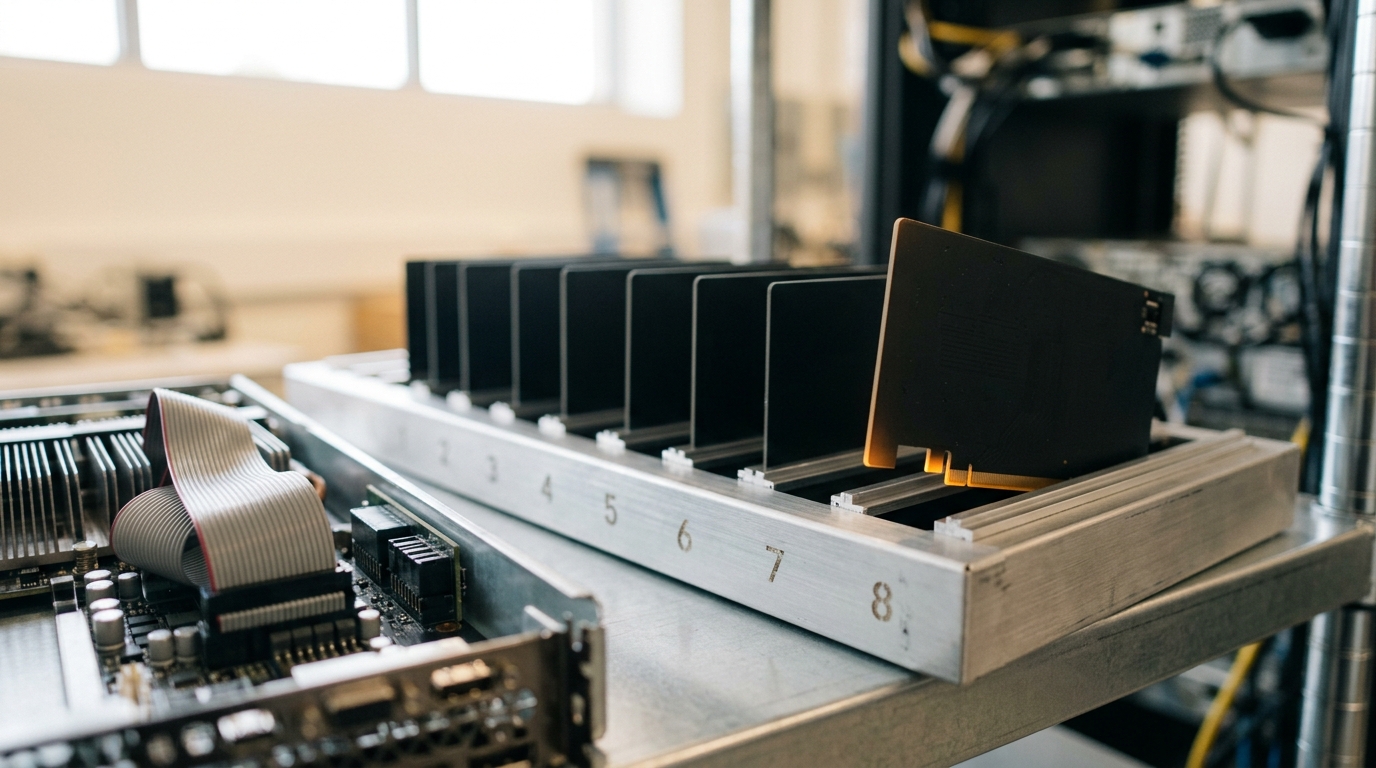
Static batching, where a fixed set of requests is batched and the whole batch waits for its slowest member to finish, wastes exactly the sliver of GPU time this article’s hero image shows: a slot that could be filled with a new arriving request but is instead held empty until the batch completes. Continuous batching — introduced under the name iteration-level scheduling in the Orca paper — instead lets the scheduler add a newly-arrived request into the batch and remove a finished one at every generation step, so the batch composition changes continuously rather than only between batches [2]. This is the specific mechanism that determines GPU utilization: at every one of the batch tray’s slots, a scheduler decision, made many times a second, decides whether that sliver of compute is sold to a customer or left idle.
Chunked prefill, described in the Sarathi-Serve paper, extends this by splitting an incoming prompt’s prefill work into smaller chunks and interleaving those chunks with other requests’ decode steps, so a single large prompt does not stall every other user’s token generation while it is processed [3]. Reported results in that paper show substantially higher throughput at the same latency bound compared with batching that does not chunk prefill, though the specific multiplier is workload- and hardware-dependent and should not be read as a universal constant. (Fact about the mechanism the paper describes; the magnitude is a benchmark result specific to the paper’s setup, not a general claim.)
A second lever operates at the memory layer rather than the scheduling layer: PagedAttention, from the paper that introduced the vLLM serving engine, manages each request’s KV cache in fixed-size, non-contiguous pages the way an operating system manages virtual memory pages, instead of pre-allocating one large contiguous memory block per request sized for its worst-case length [1]. Pre-allocation wastes memory to internal and external fragmentation; because GPU memory capacity is what limits how many requests can be batched together, wasted memory directly reduces achievable batch size and therefore utilization. The original paper reports throughput improvements over then-current serving systems attributable to this memory-management change alone [1]. (Fact, attributed to the cited paper’s own benchmark comparison — not independently re-verified here.)
Caching: paying once for the part of the prompt that does not change
Many real workloads send the model the same long prefix repeatedly — a system prompt, a codebase, a document, the earlier turns of a conversation — and only the last few hundred tokens actually change between calls. Recomputing the full prefill pass over that unchanged prefix every time is pure waste: the same matrix products get computed again for input that has not changed.
Prompt caching stores the KV cache produced by processing a prefix once, so a subsequent request sharing that prefix can skip prefill for the cached portion and reuse the stored keys and values directly. Both major API providers now price this explicitly rather than leaving it invisible inside a blended rate. Anthropic’s documentation states a cache read costs roughly one-tenth of the base input token price, while writing a new entry into the cache costs a premium over the base rate — about 1.25 times base price for a five-minute cache lifetime, or about 2 times base price for a one-hour lifetime [6]. OpenAI’s pricing page shows a comparable structure: cached input tokens are billed well below standard input tokens, with cached rates running roughly 10–50% of the standard input rate depending on the model [5]. (Fact, cited directly to each provider’s own pricing documentation, which is a vendor disclosure, not an independently audited cost figure.)

The economic logic is straightforward once the write/read asymmetry is visible: a cache write costs slightly more than a normal input token because the system still has to run the prefill pass and additionally hold the result in fast memory; a cache read costs much less because it skips prefill computation entirely and only needs a fast memory fetch. The tiered cache shelf described in this article’s second figure — a fast on-package memory tier feeding a slower DRAM tier feeding an even slower NVMe or CPU-memory tier — reflects a real design tension in serving systems: caches for many concurrent conversations cannot all live in the fastest, smallest, most expensive tier, so systems demote colder entries to slower tiers and evict them entirely once storage runs out. A “cache hit” from the fastest tier is nearly free by comparison with a full prefill; a “hit” that requires re-fetching from a demoted, slower tier is only partially cheaper. Published serving-systems literature documents the fast/slow tier trade-off in KV-cache management generally [1]; the specific tier latencies and hit-rate economics of any one provider’s production cache are not publicly disclosed, so any numeric estimate of “how much a given workload saves” is a scenario built on the provider’s stated discount rate, not a verified measurement of their internal cache hit rate. (Analysis: the mechanism is fact-grounded; the size of the saving for any specific workload is an estimate, not a disclosed figure.)
Routing: sending a question to the cheapest model that can actually answer it
A third lever operates before the request reaches a GPU at all: model routing, the practice of directing different requests to different-sized models based on estimated difficulty, rather than serving every request from the largest available model. A short factual lookup and a multi-step reasoning problem do not need the same amount of computation, and running both through the flagship model wastes compute on the easy case in exactly the way an unbatched idle GPU slot wastes it on the scheduling side.
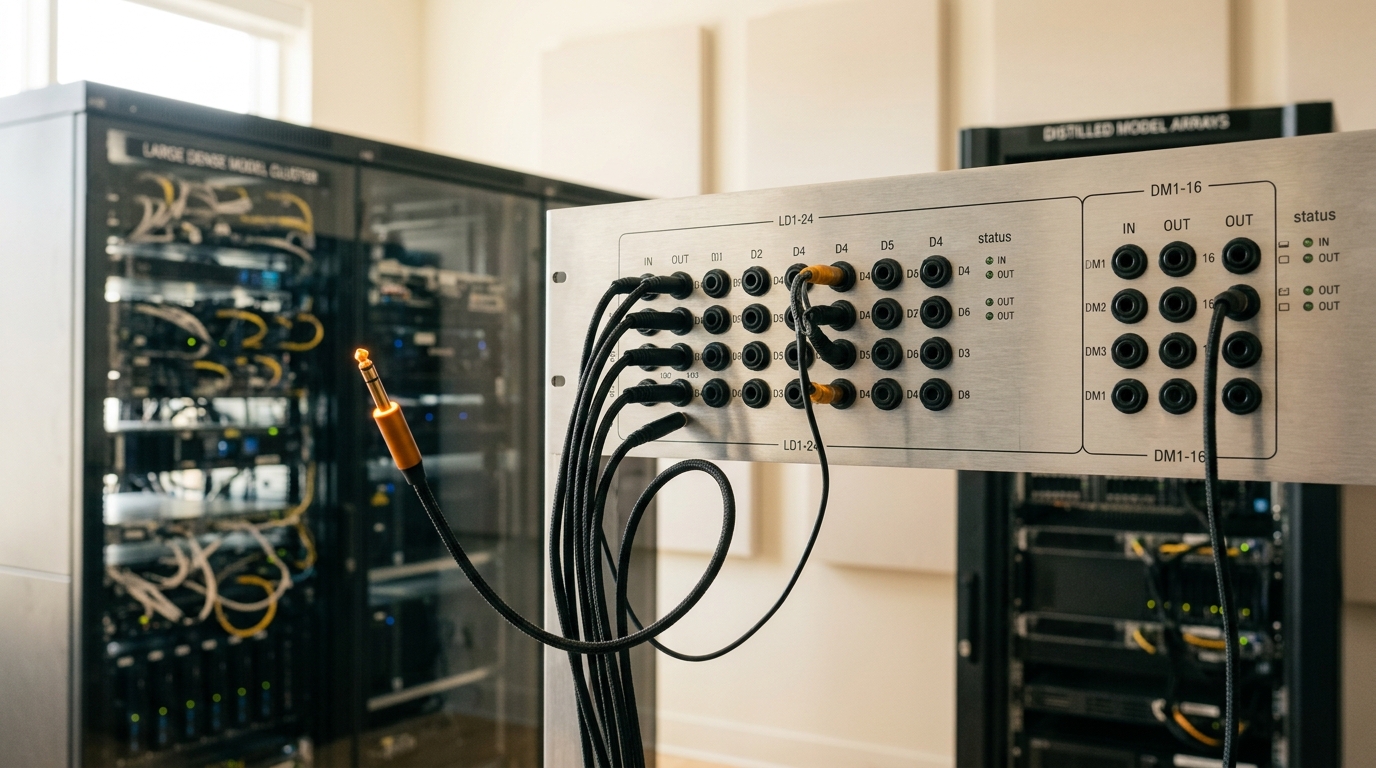
This is where the patch-bay image in this article is meant to be read literally rather than as a metaphor for something abstract: a router is a physical (or at least a discrete, auditable) decision point that ties an incoming request to one of several available racks of different model sizes, and that decision is made once, before any tokens are generated, rather than emerging gradually. Providers disclose the existence of tiered model families and service tiers explicitly — OpenAI’s pricing documentation lists multiple service tiers (including a lower-cost “Flex” tier and a discounted asynchronous “Batch” tier) at roughly half the standard per-token rate in exchange for relaxed latency guarantees [5]. (Fact: providers disclose tiering; the internal routing logic that decides which requests get sent to which tier is proprietary and not independently verifiable, so any claim about exactly how a specific vendor routes a specific request is a vendor assertion, not an independently confirmed mechanism.)
The economic effect of routing, where it is used, is straightforward in principle: average cost per request falls if a meaningful share of traffic can be served correctly by a materially cheaper model, and the aggregate price a provider can profitably charge falls with it — which is one of several forces behind the price declines Epoch AI has documented. Their analysis of six benchmarks over three years found that the price required to reach a fixed capability level (for example, GPT-4-level performance on PhD-level science questions) fell by a median of roughly 50-fold per year across benchmarks, with the fastest-falling milestones declining far faster and the slowest much less, and with the steepest declines concentrated in the period after early 2024 [8]. Epoch AI’s own write-up is explicit that this recent, fastest rate of decline is the newest and least-established part of the trend, and should not be extrapolated forward without caveat [8]. (Fact, attributed to the cited analysis; the future persistence of the fastest rate is explicitly flagged by the source itself as uncertain, not established.)
Utilization: the same chip can be priced at cost or well under it
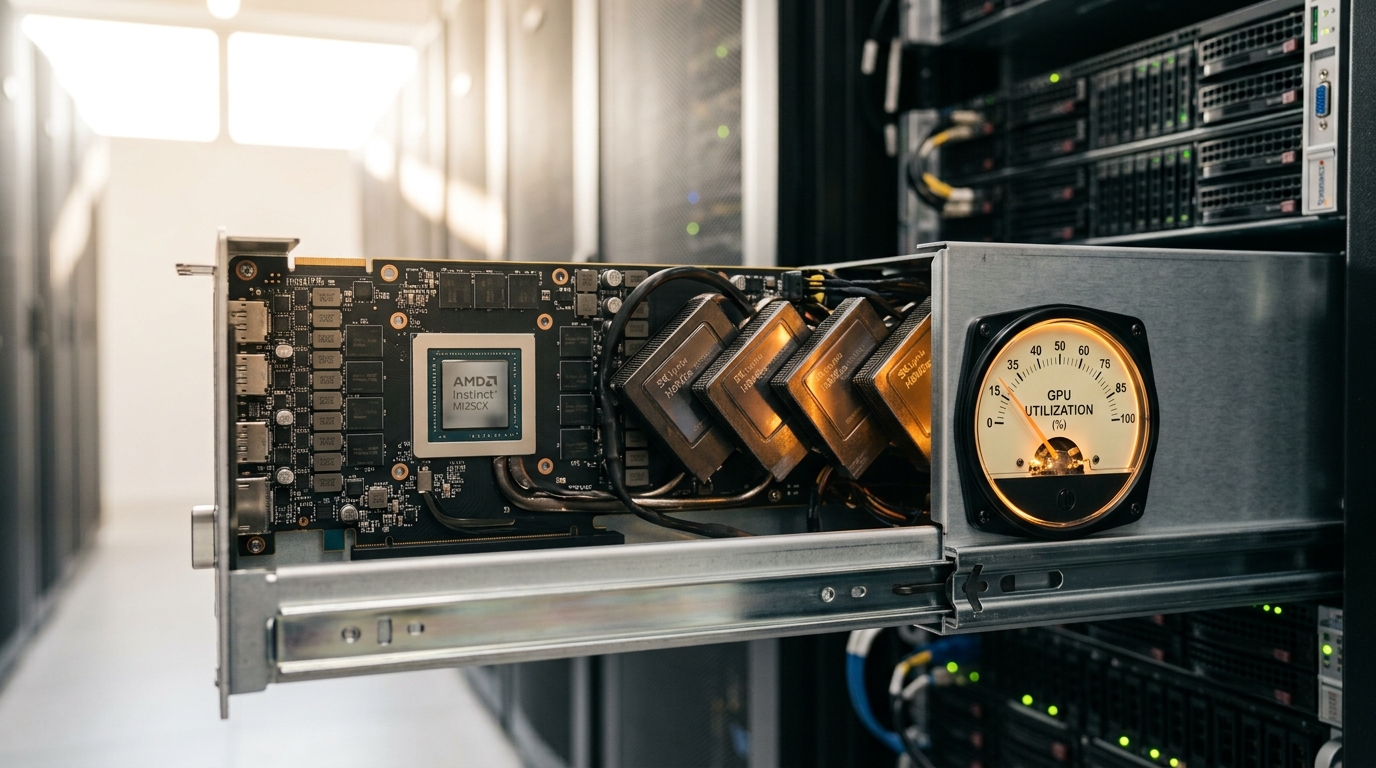
Batching, caching and routing all ultimately feed into a single number that determines whether a fleet of GPUs is a profit center or a loss: utilization, the fraction of a GPU’s available throughput that is doing billable work at any given moment, averaged over time. A GPU sitting idle between a burst of demand costs the same in capital depreciation, power and cooling whether or not a single token is generated on it. Fixed costs — the accelerator’s amortized purchase price, the rack, the power delivery, the network fabric — do not change with utilization; only the number of tokens they get divided across does.
This is the reason batching and caching matter for price rather than only for latency: a serving system that keeps a GPU at 80% average utilization across a day divides its fixed hourly cost across roughly twice as many tokens as one running at 40%, and can profitably charge roughly half as much per token for the same margin. Independent benchmarking gives some visibility into what utilization current hardware and software combinations can actually achieve under realistic load. MLCommons’ MLPerf Inference benchmark suite tests submitted systems under both a latency-bounded “server” scenario and an unconstrained “offline” scenario designed to maximize throughput through batching, and recent rounds have shown substantial throughput gains attributable specifically to newer accelerator generations and to serving-software improvements like better batching and KV-cache management, rather than to raw chip count alone [9]. (Fact, attributed to the cited benchmark reporting; MLPerf figures describe controlled benchmark conditions and are not a direct measurement of any specific commercial provider’s live-traffic utilization, which providers do not publish.)
Here
Energy: the other side of the ledger the price per token has to cover
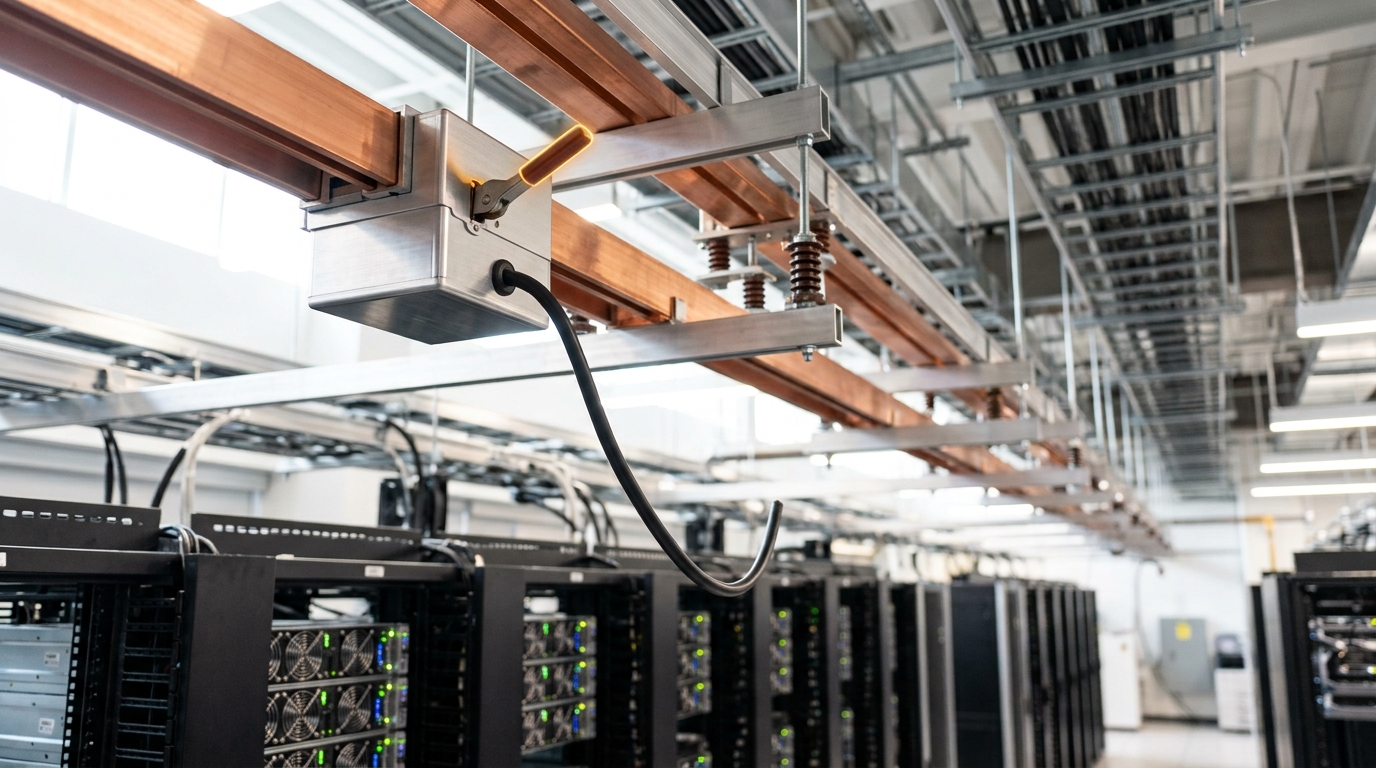
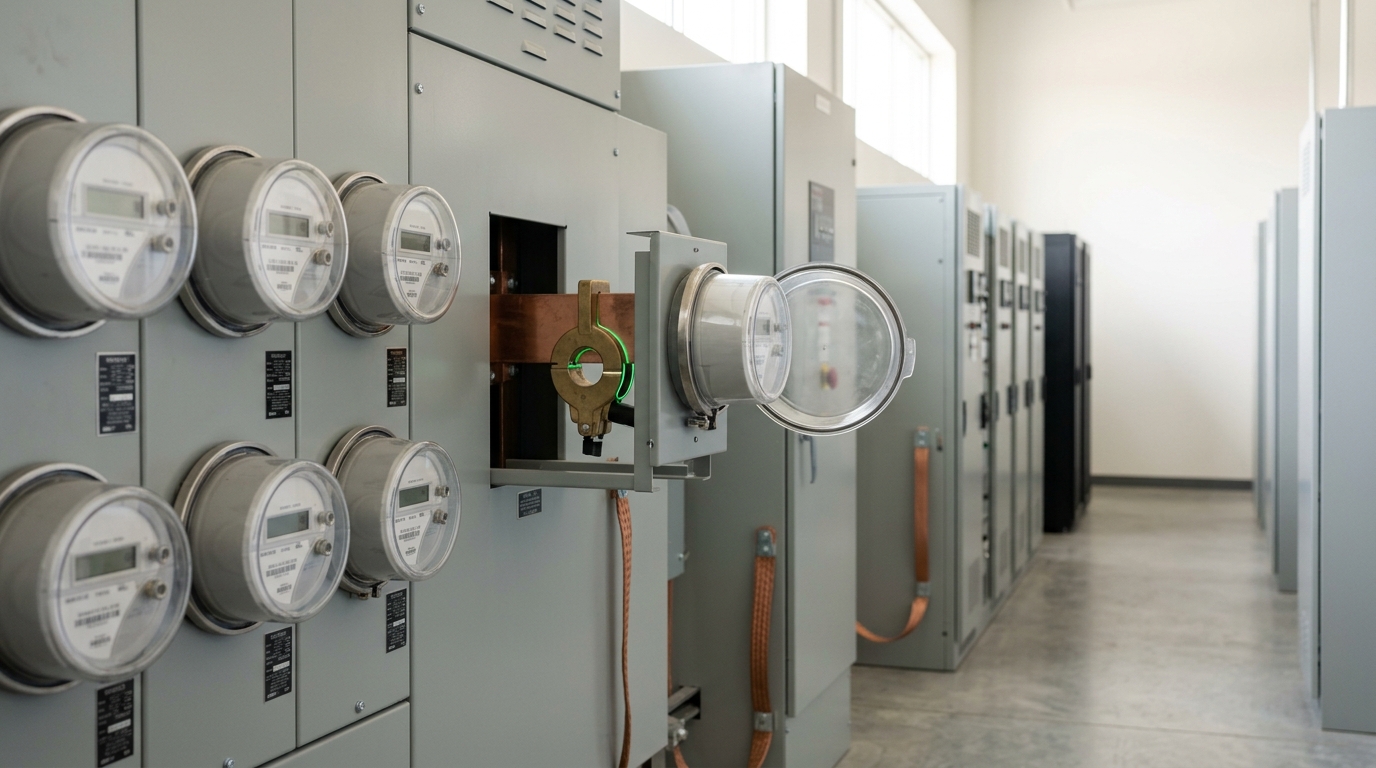
For a provider, energy is a real and rising line item, but it is one term among several in the identity above, and it is the term most directly exposed to macro risk: a provider locked into fixed-price power contracts is insulated from spot-price volatility that one relying on merchant electricity markets is not, and that difference is not visible in a per-token retail price at all. Where a specific provider’s actual power-purchase structure is not publicly disclosed, no claim about their exposure should be treated as verified — it is, at best, an informed inference from public build-out announcements, not a confirmed fact.
Margin: what is left after cost, and why it is set upstream of any one request
The gap between what a token is billed at and what it costs to serve — batching, caching, routing and utilization all accounted for — is margin, and it is set as a business decision upstream of any individual request, the way the reconciliation desk in this article’s sixth figure produces a ledger line after the fact rather than during the request itself.

Margin is not directly observable from outside a company: providers publish retail prices, and some publish aggregate figures in financial filings or investor disclosures, but the underlying unit cost of serving a token — the actual values of
Demand elasticity and the cost of built, unused capacity
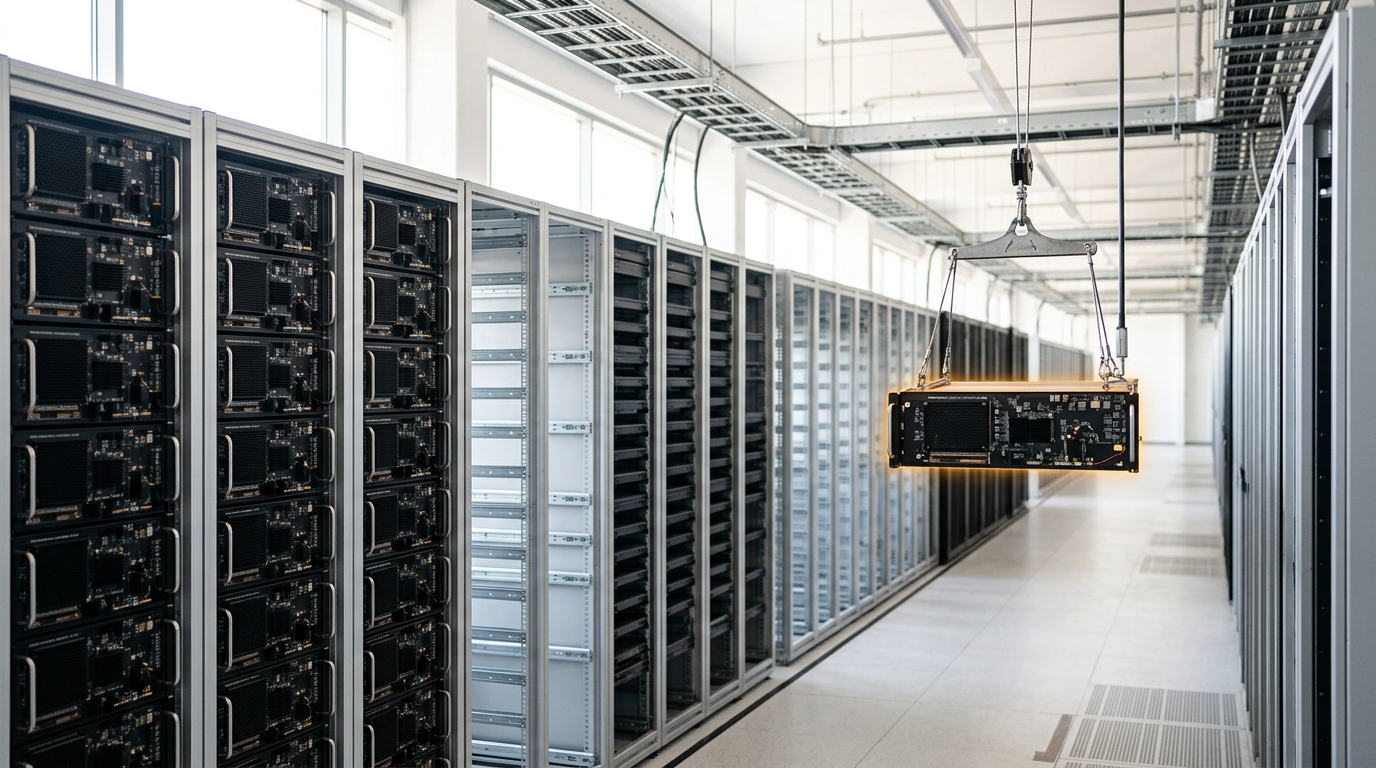
The final piece is the one the fleet-row figure in this article is built around: capacity has to be provisioned for peak demand, not average demand, because a request arriving when the fleet is saturated either queues or fails, and both are worse for a paid product than an idle GPU. This means a provider’s fleet spends much of its time below full utilization by design, and the empty bays in that image are a cost that has already been paid in capital and power draw whether or not they are filled with a running tray at any given moment.
Scenario, not fact: if demand for a given model’s inference grows in bursts around new product launches or seasonal usage, and the fixed cost of held peak capacity does not fall as fast as per-token prices are currently falling — per the Epoch AI trend discussed above — then providers face a structural squeeze between falling revenue per token and roughly fixed capacity costs, and margin compression becomes more likely regardless of any single efficiency gain. This scenario assumes that price declines continue faster than efficiency gains in batching, caching and hardware; the observable indicator to watch is whether major providers begin advertising committed-capacity discounts more aggressively (a sign that idle capacity is a growing problem) or begin raising prices on lower-tier services (a sign the squeeze has arrived). The horizon is roughly two to three years from today. The condition that would disconfirm this scenario is a sustained slowdown in the rate of per-token price decline relative to the Epoch AI trend, which would indicate providers have found a floor near their marginal cost rather than continuing to compress margin to hold market share.
What this means for anyone paying a per-token bill
None of the four levers — batching, caching, routing, utilization — are visible in a retail price by themselves; they are folded together into one number. But each is independently checkable in practice. A workload with a long, stable, reusable prefix should show a real cost difference when prompt caching is used correctly, because both major providers disclose the discount rate for cache reads explicitly [6] [5]. A workload sensitive to latency should expect to pay more for tighter guarantees, because providers explicitly price relaxed-latency batch and flex tiers below standard synchronous service [5]. And a workload that does not need the largest available model should test whether a smaller one serves it correctly, because the entire economic argument for routing depends on that gap actually existing for a given task, not on it existing in general.
Where experts and public analyses disagree — chiefly on how long the current rate of price decline can continue, and on how much of it reflects a genuine reduction in cost to serve versus a temporary willingness to run inference at a loss to hold market share — this article has not adjudicated a winner. Both dynamics are consistent with the public pricing and benchmark evidence cited here, and distinguishing between them from outside the companies involved is not currently possible with public data.
Sources rejected
An initial search surfaced several inference-cost commentary pieces (industry blog posts summarizing “AI inference cost crisis” narratives) that restated benchmark figures without linking to a verifiable primary source or that could not be independently confirmed as accurate restatements of the underlying study; those were dropped in favor of citing the Epoch AI analysis and the arXiv/IEA/MLCommons primary sources directly.