A score is not a fact, it is a configuration
“Model A scores 82 on benchmark X; Model B scores 76” looks like a fact about two objects. It is closer to a fact about two events: a specific set of test questions was shown to a specific checkpoint, run through a specific harness, at a specific reasoning-effort or decoding setting, on a specific date, and the resulting outputs were graded by a specific method. Change any one of those five things — the question set, the harness, the effort setting, the date, or the grader — and the number can move without the underlying model changing at all. This article is the opening piece in a series on comparing frontier models, and its only job is to make that claim precise enough to be useful: to show why a benchmark score is underdetermined, what the specific failure modes look like in practice, and what a reader needs to pin down before a comparison claim deserves any trust at all.
The temptation to skip this step is strong because the alternative — a leaderboard, a single sortable column of numbers — is so much easier to read. Every one of the mechanisms below exists precisely because that convenience is purchased by throwing away information the reader actually needed. None of what follows argues that frontier models cannot be compared. It argues that a comparison is a claim with hidden preconditions, and that most public comparisons never state them.
Why the same benchmark name can mean different things
The first and most basic failure is contamination: a benchmark’s questions, or close paraphrases of them, ending up inside a model’s training data, so that a high score partly reflects memorization rather than the capability the benchmark was designed to measure. A 2024 survey of the problem describes contamination as occurring when a model “inadvertently incorporate[s] evaluation benchmark information from their training data,” and catalogues detection methods, prevention strategies, and the many benchmark families across which the issue has been documented [4]. The honest difficulty here is that contamination is not directly observable from the outside. A vendor training on a large fraction of the public internet cannot fully audit, after the fact, which exact benchmark items leaked into training, and independent auditors generally cannot see the training set at all. What a reader can check is whether a benchmark is versioned against this problem — whether the evaluator holds out a private, periodically refreshed item pool rather than reusing a static public one — and treat scores on static, long-published benchmarks with more caution than scores on rotating or held-out ones.

A second, quieter source of divergence is the evaluation harness itself: the prompt template, the number of few-shot examples, the parsing rule used to extract an answer from free text, and the exact wording of the question. Independent work on this specific question found that “existing approaches fail to effectively tackle” the problem of predicting which prompts are sensitive to minor wording changes, after testing multiple state-of-the-art methods against a purpose-built dataset [11]. Two labs can report scores on a benchmark with an identical public name and produce numbers that are not directly comparable, because each ran its own harness against it. Epoch AI’s own benchmarking hub, which aggregates results run internally, run by benchmark creators, and self-reported by model developers into one database, exists partly for this reason: keeping the three provenance categories visibly separate is itself an acknowledgment that a shared benchmark name does not guarantee a shared measurement [1]. A benchmark name is a label for a family of possible measurements, not a single fixed one, and the burden is on whoever cites a score to say which member of the family they mean.
What an arena leaderboard actually estimates
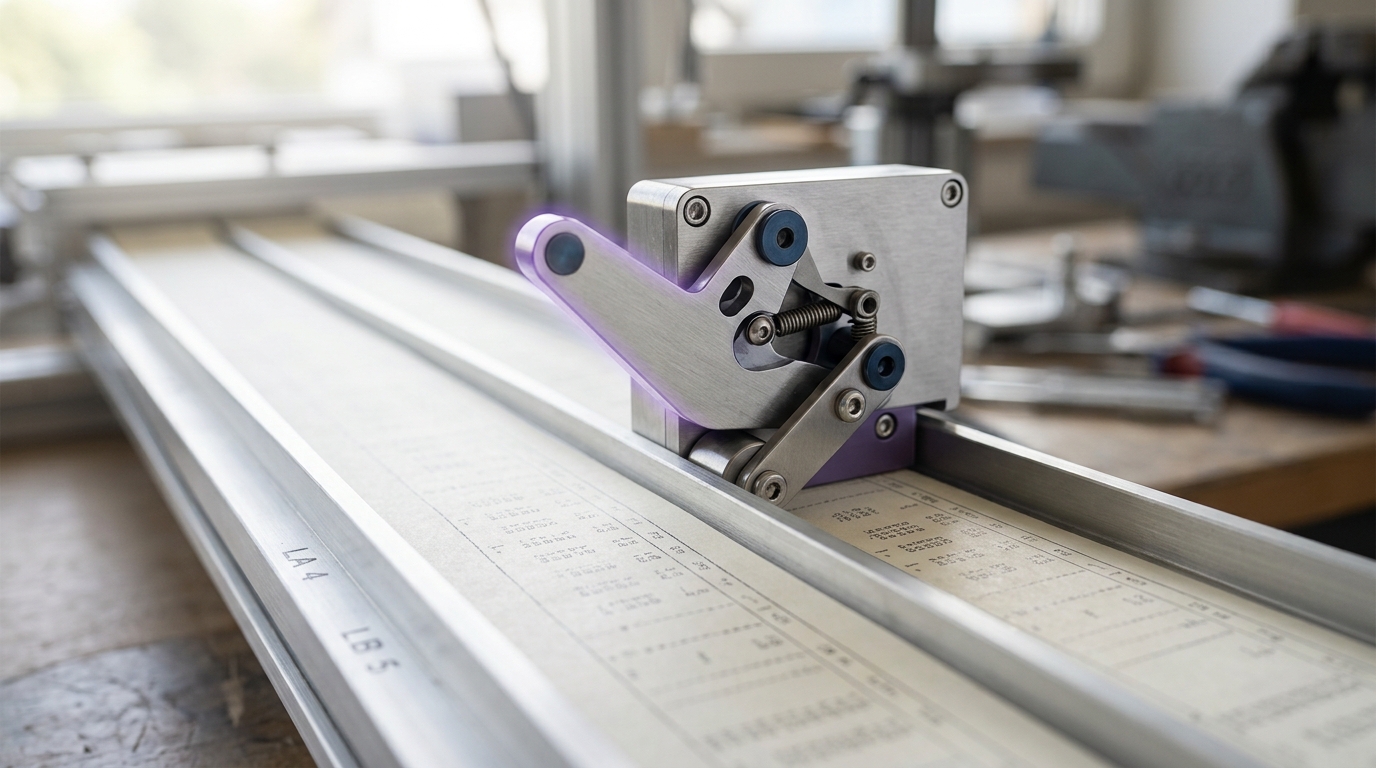
A different style of evaluation sidesteps fixed question sets altogether by asking humans which of two anonymized model outputs they prefer, on real conversational prompts, and aggregating millions of these paired judgments into a ranking. Chatbot Arena, the platform behind this approach, describes itself as using “a pairwise comparison approach” that “leverages input from a diverse user base through crowdsourcing,” with the underlying statistics resting on a standard paired-comparison model rather than a raw win count [6]. The relevant object is a Bradley–Terry model: each system
What this equation exposes matters more than the arithmetic:
This is not merely a theoretical caveat. An independent 2025 analysis of Chatbot Arena’s own operation reported systemic asymmetries in how ratings are produced: proprietary systems received disproportionate shares of the comparison data used to fit their ratings — the paper’s authors put Google’s and OpenAI’s shares of total battles at roughly 19.2% and 20.4% respectively, against 29.7% collectively for 83 open-weight models — and found that “access to Chatbot Arena data yields substantial benefits,” with relative performance gains of up to 112% reported on the arena’s own distribution when a model’s developer had more of that data available for tuning [5]. The same paper also describes selective disclosure practices, in which providers can test multiple private variants and choose which results become public. None of this means the leaderboard is fraudulent or useless; arena-style evaluation genuinely captures something no static benchmark does, namely preference under real, open-ended use. It means a single arena rank is the output of a specific, documented, and imperfectly representative sampling process, and should be read as exactly that rather than as a scoreboard of underlying merit.
Multimodal scope is not a footnote
A comparison also has to agree on what the two systems are even being asked to do, and current frontier systems do not share a scope. Google DeepMind’s model card for Gemini 3.1 Pro describes the model as accepting “text strings… images, audio, and video files,” with a token context window of up to one million tokens and output capped at 64,000 tokens, and characterizes it as natively multimodal [8]. OpenAI’s developer documentation for GPT-5.6 Sol, by contrast, lists a 1.05 million token context window with input modalities of “text, image” and output modality of “text” only — audio and video are not listed as accepted inputs for that particular model in that documentation [9]. These are vendor-published specifications, not independent measurements, and they should be read as such. But the specifications themselves already show that “compare Model A and Model B” is underspecified until the comparison states which modality is being tested. A benchmark administered purely in text says nothing about a video-understanding gap or advantage, and a benchmark that requires audio input simply cannot run on a system whose documented inputs stop at text and image. Treating “multimodal capability” as one further column on a leaderboard, alongside a text-reasoning score, obscures that the two systems may not even be answering the same category of question.
The practical consequence is a scoping question that has to be answered before any other comparison question: is the claim “Model A is a better reasoner” (comparable on shared text-only ground) or “Model A is a better multimodal assistant” (which requires the compared systems to actually share the modality being tested, and for the benchmark to isolate that modality rather than let a text shortcut solve it)? These are different claims requiring different evidence, and a single benchmark run rarely supports both.
Capability is a curve, not a point: cost and latency
Even once question set, harness, and scope are fixed, a further axis moves independently of raw accuracy: how much computation, time, and money went into producing the answer. OpenAI’s documentation for GPT-5.6 Sol lists a reasoning.effort parameter with named settings from none up through max, alongside per-token pricing that the same documentation states was recently reduced by “a 20% reduction in input pricing and a 33% reduction in output pricing,” with an additional multiplier applied once input length passes 272,000 tokens [9]. That single control surface means a reported benchmark number is a point sampled from a curve relating spend to quality, and the same model can occupy very different points on that curve depending on which effort level a vendor chose to report.
Independent measurement of the resulting economics is exactly the gap that dedicated benchmarking services try to fill. Artificial Analysis states that its methodology covers “intelligence, quality, performance and price benchmarking on AI models, inference API endpoints and systems,” explicitly aiming “to reflect actual customer experiences rather than theoretical maximum performance,” and tracks metrics including time to first token, output tokens per second, and a blended cost figure combining input, output, and cached-token pricing [2]. Because that data is collected against live, hosted endpoints rather than vendor-reported figures, it captures something model cards typically do not: what a given quality level actually costs and how long it actually takes to arrive, under real serving load rather than a controlled disclosure.
The upshot for comparison is procedural rather than mathematical: a quality difference reported at two different, unstated cost or latency points is not evidence that one system is more capable, only that it was run more expensively or more slowly. The only comparison that isolates capability from spend is one that holds cost or latency fixed and asks which system reaches a higher quality bar at that fixed point — or, symmetrically, fixes a quality bar and asks which system reaches it more cheaply. Almost no public comparison does this explicitly, which is itself informative about how much of the headline gap between two reported scores is actually a gap in how much was spent to get them.
Safety posture has no common unit
The fifth axis is the least standardized of all. Vendors describe safety and alignment work through different frameworks, at different levels of detail, using different thresholds, and there is no shared metric analogous to accuracy that lets a reader collapse this into one number. Anthropic’s announcement of Claude Opus 4.5 describes it as “the most robustly aligned model we have released to date” and reports “substantial progress in robustness against prompt injection attacks” — a vendor’s characterization of its own safety testing, stated as a claim, not an independently audited figure [10]. Google DeepMind’s Gemini 3.1 Pro model card takes a different form again, reporting small percentage-point shifts on internal automated safety evaluations relative to the prior model and separately describing frontier risk testing across categories such as CBRN, cyber, and misalignment against the company’s own capability thresholds [8]. These are not directly stackable: one is a prose claim about relative robustness, the other a set of category-specific threshold tests, and neither maps onto the other in any mechanical way.
A separate, independent effort measures something narrower but externally reproducible: METR’s task-completion time horizon estimates “the task duration… at which an AI agent is predicted to succeed with a given level of reliability,” fitted from an agent’s performance on real software, ML, and cybersecurity tasks against skilled-contractor baselines [3]. This is directly relevant to safety posture, because rising autonomous task competence is one of the concrete indicators used to argue that oversight needs to keep pace with capability — but METR’s own documentation is explicit that its current task suite becomes unreliable above roughly sixteen hours of estimated horizon, that its coverage should not be read as a complete record of the most capable models, and that its tasks are cleaner and more algorithmically scoreable than most real jobs. It is one well-documented instrument, not a universal safety score.
Stanford HAI’s 2026 AI Index adds a broader, more sobering fact about the state of reporting itself: “almost all leading frontier AI model developers report results on capability benchmarks, but reporting on responsible AI benchmarks remains spotty,” and the report’s own tally of documented AI incidents rose from 233 in 2024 to 362 in 2025 [7]. Put plainly: capability comparison is already hard, for the reasons above, but at least it is attempted with some consistency across vendors. Safety-posture comparison is harder still, because the underlying disclosures are neither consistent in form nor consistently made at all. Where a reader sees a vendor claim, an independent instrument, and a documented reporting gap presented side by side, the honest response is to note the disagreement and the asymmetry in evidence quality, not to average them into a single safety verdict.
A worked illustration of why naive ranking fails
Two published numbers make the underdetermination concrete without requiring anyone to guess at anything. Google DeepMind’s Gemini 3.1 Pro model card reports 80.6% on SWE-bench Verified, alongside a one-million-token multimodal context window accepting text, image, audio, and video [8]. OpenAI’s documentation for GPT-5.6 Sol reports a distinct claim — that the model “reaches frontier performance with fewer output tokens” — alongside a 1.05-million-token context window and a documented input scope of text and image only, with no audio or video input listed [9].
It is tempting to read these two facts side by side and conclude something about which system is “ahead.” That conclusion would not be supported by what is actually in front of the reader. The two SWE-bench-style figures were not run on the same date, under the same harness version, at the same reasoning-effort setting, or against confirmation that neither benchmark’s test items had ever appeared in either model’s training data. The context-window figures are close in size but attach to different accepted input scopes, so a token-for-token comparison silently compares a broader multimodal capacity against a narrower one. And neither figure is expressed at a matched cost or latency point, so even a real quality difference could be entirely explained by one system being run at a more expensive configuration than the other. This is not a defect in the two documents — a model card and a piece of API documentation are not trying to be a controlled comparative study, and neither vendor claims that they are. The point of setting them next to each other here is narrower and entirely deliberate: two real, verifiable, honestly reported numbers can look like a ranking and not be one, because the conditions that would make them comparable were never fixed in the first place. This is also why this article does not attempt to convert either vendor’s disclosures into an ordered list of which frontier model is “best” — that ordering is exactly the artifact the rest of this piece has argued cannot be honestly constructed from numbers like these.
A slightly more general way to see the same point: any observed score can be written as
where
What a reader needs fixed before trusting any comparison
Collecting the mechanisms above into a working checklist:
Is the question set contamination-checked, or at least dated and versioned? A static, long-public benchmark score deserves less weight than one drawn from a held-out or periodically rotated item pool [4].
Was the same harness used for both numbers? Prompt template, few-shot count, and answer-extraction rule all move scores independently of the underlying model [11].
If it is an arena-style rating, what population produced it? A preference rating is fitted from a specific prompt and voter distribution, and documented sampling asymmetries mean that distribution is not neutral across vendors [6, 5].
Do both systems actually accept the modality being tested? A comparison claim about multimodal ability requires the compared systems to share the input scope the benchmark exercises [8, 9].
Are the two numbers reported at a matched cost or latency point? Absent that, a quality gap may simply be a spend gap [2, 9].
Is the safety claim a vendor assertion, an independently reproducible instrument, or neither? These carry different evidentiary weight and are not mutually convertible [10, 3, 7].
Any comparison claim missing an answer to one of these six questions is not yet a measurement — it is a plausible-sounding sentence built on an unstated configuration.
Predictions, and what would falsify them
These are forecasts, explicitly separated from the sourced analysis above. Horizon: 22 August 2029.
One. Independent, methodology-disclosed benchmarking services covering cost and latency alongside quality will grow from a niche reference into a standard citation in procurement decisions, displacing reliance on vendor-reported headline scores alone. Assumption: API-hosted inference remains the dominant access mode for frontier models. Indicator: a rising share of enterprise procurement documentation citing services in the mold of Artificial Analysis or Epoch AI’s hub by name. Disconfirmed if vendor self-reported benchmark tables remain the primary citation in such documentation through the horizon date.
Two. At least one major arena-style leaderboard will publicly adopt disclosed, audited sampling quotas across providers in response to documented asymmetries of the kind reported in the Leaderboard Illusion analysis. Assumption: arena-style evaluation continues to be commercially and reputationally significant enough to justify the audit cost. Indicator: a published methodology change explicitly citing battle-count balancing. Disconfirmed if by the horizon date no major arena platform has published such a change despite continued documentation of sampling asymmetry.
Three. Contamination-resistant, rotating-item benchmarks will become the default expectation for any newly introduced capability benchmark intended to compare frontier models, rather than an optional extra. Assumption: the cost of generating fresh held-out items at benchmark scale continues to fall. Indicator: a majority of newly launched capability benchmarks in the field explicitly advertising rotation or hold-out design. Disconfirmed if newly launched benchmarks in 2029 are still predominantly static public sets with no contamination mitigation.
Four. Safety-posture reporting will remain the least standardized of the five axes discussed here through the horizon date, with vendor self-report continuing to dominate over independently reproducible instruments. Assumption: no binding cross-vendor disclosure regulation with technical teeth is enacted in major markets before 2029. Indicator: Stanford HAI’s AI Index or a comparable annual tracker still describing responsible-AI benchmark reporting as inconsistent relative to capability reporting. Disconfirmed if a comparable share of frontier vendors are, by 2029, publishing safety evaluations against one shared, independently audited framework.
What to take away
A benchmark score is not a property of a model; it is a property of a model placed inside a specific, largely unstated configuration — a question set that may or may not be contamination-checked, a harness that shapes the number independently of capability, a modality scope that may not match between the two systems being compared, a cost and latency point chosen by whoever ran the test, and a safety disclosure that may be a vendor’s own claim rather than an independent measurement. None of this makes frontier models incomparable. It means a trustworthy comparison has to state, explicitly, which of those five things it has held fixed — and a comparison that cannot answer that question is not yet a comparison. The rest of this series takes each of those five axes in turn and asks what a rigorous version of that specific comparison actually looks like.