The Valley of Stability Is a Fitness Landscape
Beta decay descends a binding-energy gradient the way an adaptive walk descends a fitness surface. Evolutionary nuclear physics grades that mapping term by term — exact where the physics is local, broken where it needs heredity nuclei do not have.
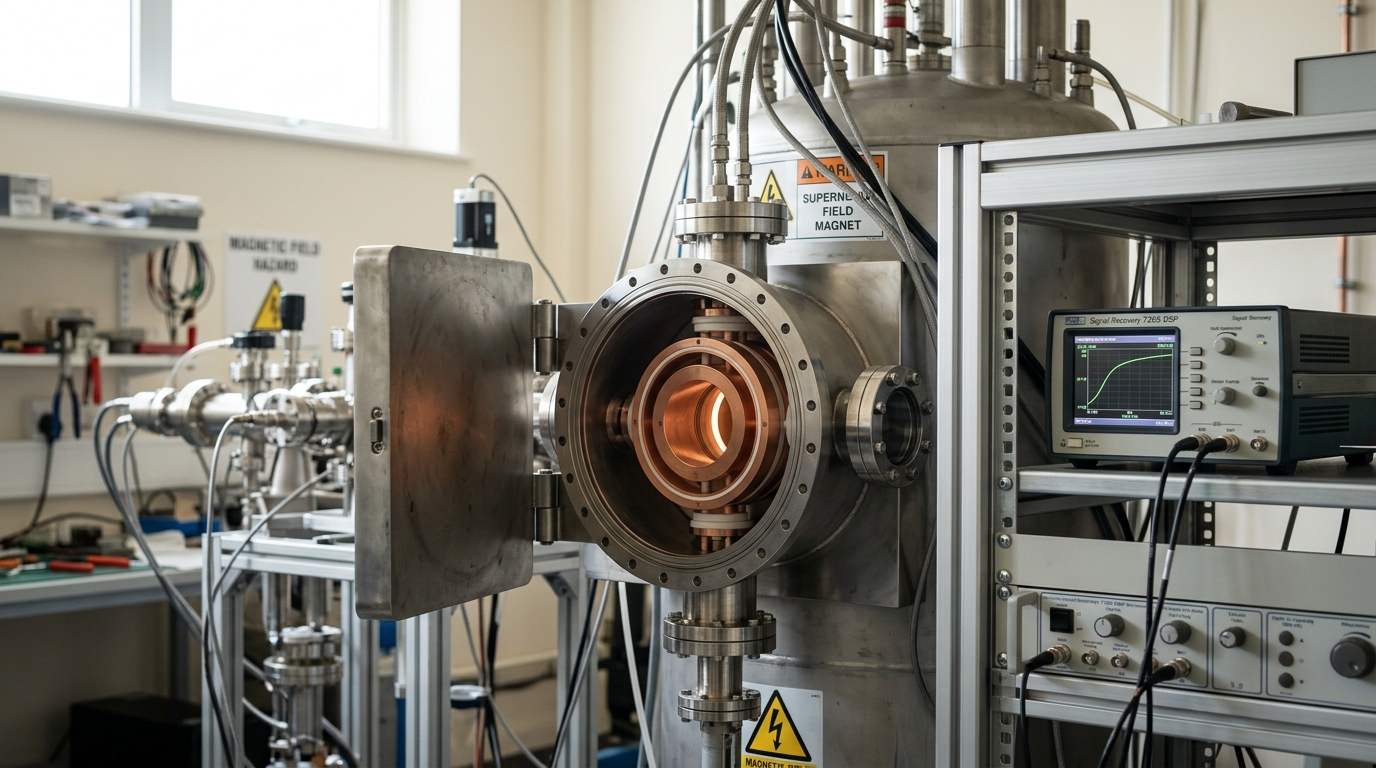
Every point on the chart of nuclides is a measured mass, and a mass is measured one trapped ion at a time. — Image prompt and art direction by Brecht Corbeel; generation pending.
Abstract
This article develops "evolutionary nuclear physics" — a term coined here — as a working lens on the chart of nuclides: binding energy per nucleon read as a fitness function over the discrete space of (N,Z) combinations, beta decay read as single downhill steps at fixed mass number, magic numbers read as adaptive peaks, and the drip lines read as a viability boundary. It states the semi-empirical mass formula term by term as topography, verifies the iron-nickel subtlety at the global optimum, follows uranium-238's fourteen-step decay chain as a recorded walk, and closes with a graded audit of the analogy: exact for a scalar objective under local moves, broken for the absence of heredity, population, and selection that biology's landscape metaphor — itself borrowed from physics by Sewall Wright in 1932 — actually requires.
A single nucleus is weighed, not calculated
A Penning trap does one thing: it holds a single charged particle in a magnetic field strong enough, and a vacuum clean enough, that the particle’s cyclotron orbit can be timed with almost no interference from anything else in the universe. The orbit frequency depends on the particle’s mass. Because that frequency can be compared against a reference ion’s frequency to fractional precision near one part in ten billion, the technique converts an orbital period into a mass measurement of extraordinary accuracy. A 2020 result from the PENTATRAP collaboration, comparing cyclotron frequencies of a highly charged rhenium ion in two internal states, reports a fractional precision of one part in one hundred billion — \delta R = 1\times10^{-11} — in a single-ion Penning-trap measurement [9]. The same family of instrument, applied across an isobaric chain rather than within one ion’s internal structure, is how the mass differences that fix nuclear binding energies are actually obtained; Klaus Blaum’s 2006 review of high-accuracy stored-ion mass spectrometry surveys the broader apparatus this article’s figures are drawn from — magnetic and electrostatic ion traps, buffer-gas cooling, time-of-flight and image-current detection — as the standard toolkit of the field [10]. Binding energy, in other words, is not a number physics calculates from first principles and checks against experiment. For all but the very lightest nuclei it is a number physics weighs, and the chart of nuclides is a record of those weighings.
Very few of those masses come from a single direct measurement in isolation. The AME2020 evaluation, the current reference compilation of atomic masses, is built by treating every published measurement — direct mass-spectrometric ratios, reaction and decay energies, alpha- and beta-decay endpoints — as one edge in a large connected network linking thousands of nuclides back to a small set of absolutely fixed reference masses, then solving the whole network by least squares so that every mass is consistent with every measurement that touches it, directly or through a chain of intermediates [1]. A single Penning-trap measurement of one mass difference therefore does not just fix one point; it can propagate through the network and sharpen the recommended value of every nuclide connected to it, which is part of why the newest, highest-precision trap measurements continue to revise entries far from the specific nuclide actually weighed.
That chart is a discrete space. Each point is a pair of integers, a proton number Z and a neutron number N, and at each occupied point sits one nuclear species with a measured or estimated mass. The 2020 evaluation of nuclear structure and decay properties, NUBASE2020, lists recommended ground-state properties for 3,340 nuclides, plus a further 1,938 excited isomeric states, drawn from the accumulated experimental record [2]. That is the occupied fraction of a much larger space. A 2012 Nature study using nuclear density functional theory across several Skyrme energy-density functionals estimated that the number of nuclides bound against particle emission, running from hydrogen up to element 120, is around 7,000 — meaning roughly half of the nuclear landscape’s occupiable territory remains outside anything ever produced or observed in a laboratory [3]. Those two numbers, one counted and one extrapolated, are the entire setup for what follows: a finite, mapped region surrounded by a larger, only partially charted one, every point on it carrying a single scalar value — its binding energy per nucleon — that can be measured, tabulated, and compared.
This publication calls the reading that follows “evolutionary nuclear physics.” The term is coined here, not borrowed from an existing subfield, and it names a deliberate fusion: the formal apparatus of evolutionary theory — a population moving over a landscape of possible states, a fitness function assigning each state a scalar value, selection favoring higher values, drift and mutation supplying the moves — mapped onto the actual subject matter of nuclear physics, where the “states” are nuclides, the “moves” are radioactive decays, and the “fitness” is binding energy per nucleon. The mapping is offered as a working lens, not a discovery about biology or a reduction of physics to metaphor. Every step of it will be graded for how far it actually holds. Some of it is exact: a scalar objective function defined over a discrete space, with well-defined local moves and no long-range foresight, is precisely what an adaptive walk needs, and the chart of nuclides supplies exactly that structure. Some of it breaks completely: there is no population of nuclei competing for resources, no heredity by which a favorable configuration copies itself into descendants, and no variation-selection loop running across generations. A single nucleus, decaying once, is not a population evolving. Naming exactly where the line falls is the point of the exercise, and it is where the analogy earns its keep rather than merely decorating a physics article with borrowed vocabulary.

Figure 1. The chart of nuclides is not a picture; it is a beamline's worth of distinct species, delivered and weighed one at a time. — Image prompt and art direction by Brecht Corbeel; generation pending.
Binding energy per nucleon is the landscape’s fitness function
The quantity that plays fitness’s role has a name in nuclear physics already: binding energy per nucleon, B(A,Z)/A, where A = N + Z is the mass number. It is the energy that would have to be supplied to disassemble a nucleus into Z free protons and N free neutrons, divided by the number of nucleons, and a higher value means a more tightly bound, lower-energy configuration — precisely the sense in which a fitness function assigns a scalar payoff to a state. The theoretical account of how that payoff varies across the chart is the semi-empirical mass formula, first written down by Carl Friedrich von Weizsäcker in 1935 as a liquid-drop model of the nucleus [11]. In one common form, the binding energy is
B(A,Z) = a_V A - a_S A^{2/3} - a_C \frac{Z(Z-1)}{A^{1/3}} - a_A \frac{(A-2Z)^2}{A} + \delta(A)
with a pairing term commonly written
\delta(A) = \begin{cases} +a_P A^{-1/2} & \text{even-even } N,Z \\ 0 & \text{odd } A \\ -a_P A^{-1/2} & \text{odd-odd } N,Z \end{cases}
Read as a fitness landscape, each term is a distinct cost or bonus of viability rather than an abstract fitting parameter. The volume term, a_V A, is the baseline: every nucleon in the interior feels attraction from its immediate neighbors, so binding energy grows roughly in proportion to the number of nucleons, the way a population’s raw fitness might scale with sheer numbers before any structural penalty is applied. The surface term, -a_S A^{2/3}, subtracts a cost proportional to surface area, because nucleons at the boundary have fewer neighbors to bind to — a tax on being exposed at the edge of the configuration, heaviest for small A where the surface-to-volume ratio is largest. The Coulomb term, -a_C Z(Z-1)/A^{1/3}, is a pure liability: mutually repelling protons cost binding energy in proportion to roughly Z^2, which is why the landscape eventually tilts against very proton-heavy states no matter how favorable the other terms are. The asymmetry term, -a_A (A-2Z)^2/A, penalizes any departure from N=Z, reflecting the quantum-mechanical cost of filling one nucleon species’ energy levels higher than the other’s while leaving lower levels of the other species empty; it is the term that pulls the landscape’s ridge line away from N=Z as A grows, because the Coulomb term is simultaneously pushing the same ridge toward neutron excess. The pairing term, finally, is a small but structurally important bonus for even-even nuclei and penalty for odd-odd ones, tracing directly to the tendency of like nucleons to couple into paired configurations of lower energy — a bonus with no analogue among the smoothly varying terms, and the term responsible for one of the sharpest features of the landscape’s fine structure, discussed below.
Where does this landscape’s single highest point sit? The popular answer is iron-56, and it is not quite right. Iron-56 is exceptionally tightly bound, at roughly 8.79 MeV per nucleon, and it is the dominant endpoint of stellar silicon burning, which is why it is so often named as the peak. But a careful 1995 analysis in the American Journal of Physics, examining which nuclide actually carries the highest mean binding energy once the full mass table is consulted rather than a textbook shortcut, found that nickel-62 sits fractionally higher than iron-56, with iron-58 also edging above iron-56 in between them [13]. The magnitude of the gap is small — a few parts in ten thousand of the binding energy per nucleon — but the ordering is unambiguous once masses are taken from a full evaluation such as AME2020 rather than approximated [1]. The reason nickel-62 rather than iron-56 sits at the true global optimum is instructive for the landscape reading: iron-56’s fame comes from being the most abundant product of a kinetic pathway, nuclear statistical equilibrium in a supernova’s silicon-burning shell, not from occupying the landscape’s actual summit. Stellar nucleosynthesis climbs efficiently toward the peak without necessarily reaching its single highest point, in the same way an adaptive walk under strong drift or a jagged approach can settle near, rather than exactly on, a fitness optimum. The distinction between “the most common outcome of the dominant pathway” and “the landscape’s true maximum” is one that a landscape framing makes explicit; without it, the two are easily conflated.

Figure 2. Iron-56 is the famous answer to which nucleus sits at the top of the binding-energy curve; nickel-62, weighed against it in the same source, is the correct one. — Image prompt and art direction by Brecht Corbeel; generation pending.
Beta decay is a single downhill step at fixed mass number
Fix the mass number A and let Z vary. Because the Coulomb and asymmetry terms in the semi-empirical mass formula are both approximately quadratic in Z at fixed A, the atomic mass along an isobaric chain is, to good approximation, a parabola in Z:
M(A,Z)\,c^2 \approx \alpha(A) - \beta(A)\,Z + \gamma(A)\,Z^2 \mp \delta(A)
where \alpha, \beta, and \gamma collect the volume, surface, Coulomb, and asymmetry contributions and the pairing term \delta(A) shifts the curve up or down depending on whether N and Z are both even or both odd. For odd A, exactly one of N, Z is even and the pairing term vanishes, giving a single parabola with one minimum: one value of Z at that mass number is the most tightly bound, and every other isobar decays toward it by beta-minus emission (if it sits to the neutron-rich side) or by positron emission or electron capture (if it sits to the proton-rich side). For even A, the pairing term splits the curve into two parabolas — one for even-even nuclei sitting lower in mass (more bound), one for odd-odd nuclei sitting higher — offset from each other by roughly 2\,a_P A^{-1/2}. This is the double-parabola structure behind one of the chart’s more striking features: a modest number of even mass numbers host two, and even three, beta-stable even-even isobars side by side, because an odd-odd nucleus between them would have to climb over the even-even parabola’s higher wall to decay by a single beta step in either direction, and single beta decay cannot skip that wall in one move. NUBASE2020’s compiled ground-state properties record this pattern directly, in the small set of mass numbers with more than one nuclide, of the same parity family, that show no observed beta decay at all [2].
Each individual beta decay, then, is a single step along this fixed-A parabola: a discrete jump from one (N,Z) point to its immediate neighbor at (N-1,Z+1) or (N+1,Z-1), taken because it lowers the mass and therefore raises binding energy per nucleon, with the released energy carried off by the emitted lepton and antineutrino or neutrino. A decay chain is a sequence of such steps, sometimes purely beta, more often threaded with alpha emissions that jump A downward by four and Z downward by two in a single move. Uranium-238’s decay chain to stable lead-206 is the standard worked example, and it takes fourteen recorded steps to complete: an alpha emission to thorium-234, a beta decay to protactinium-234, a second beta decay to uranium-234, then a run of five consecutive alpha emissions down through thorium-230, radium-226, radon-222, polonium-218, and lead-214, a beta decay to bismuth-214, a further beta decay to polonium-214, an alpha emission to lead-210, a beta decay to bismuth-210, a beta decay to polonium-210, and a final alpha emission to stable lead-206 [2]. At three points along that path — after polonium-218, after bismuth-214, and after bismuth-210 — a minority branch peels off toward a different intermediate nuclide entirely, only to rejoin the dominant line one or two steps later; the chain is not a single deterministic line so much as a strongly dominant path with occasional forks, each fork itself a competition between two available downhill moves at that node.

Figure 3. At fixed mass number, beta decay is a single step along a parabola in charge; wiring one trap to isolate one isobaric chain is how that step gets weighed. — Image prompt and art direction by Brecht Corbeel; generation pending.
The rate of each step varies by a span that is difficult to convey without sounding like hyperbole, and the chart of nuclides is, among other things, a map of that variation. At the fast extreme, some of the lightest particle-unbound configurations decay in a time too short to be meaningfully called a “half-life” in the ordinary sense — lithium-5, unbound against proton emission, has a tabulated half-life of less than 10^{-21} seconds. At the slow extreme, tellurium-128’s double-beta decay to xenon-128 proceeds with a half-life of 7.7(4)\times10^{24} years according to NUBASE2020’s current tabulation, the longest half-life recorded for any nuclide established to be radioactive [2]. That is a range of more than fifty orders of magnitude in decay rate across nuclides that otherwise sit on the same chart, obeying the same landscape topography, differing only in how deep a barrier separates them from their downhill neighbor and by what mechanism that barrier can be crossed. Read as a gradient map, the half-life at each point is not a separate piece of information layered on top of the binding-energy landscape; it is a direct expression of how steep, and how tunnelable, the local slope actually is.
Shell closures are peaks; drip lines are cliffs
Superimposed on the smooth topography the semi-empirical mass formula describes is a set of sharp local peaks that the liquid-drop picture cannot produce at all. In 1949, Maria Goeppert Mayer published a systematic case, built from the accumulated evidence of unusually low neutron-capture cross-sections, higher first-excited-state energies, and anomalously large numbers of stable isotopes and isotones, that nuclei with 50 or 82 protons, or 50, 82, or 126 neutrons, are unusually stable — closed shells, by direct analogy with the closed electron shells that make noble gases chemically inert [5]. In the same year and independently, Otto Haxel, J. Hans D. Jensen, and Hans Suess published the same conclusion, and the pair of papers, arriving at an explanation resting on strong spin-orbit coupling in the nuclear potential, jointly established the nuclear shell model; Mayer and Jensen shared the 1963 Nobel Prize in Physics for the work [6]. The magic numbers — 2, 8, 20, 28, 50, 82, and 126 — are the landscape’s genuine local peaks in a sense the liquid-drop terms alone do not supply: a nucleus with a closed shell sits measurably higher in binding energy per nucleon than smooth interpolation between its neighbors would predict, exactly as an adaptive peak sits above the surrounding fitness surface by more than the local gradient alone would account for. The signature is sharpest in the neutron (or proton) separation energy — the cost of removing one more nucleon from an otherwise identical isotope — which drops abruptly immediately after a magic number is crossed, the nuclear analogue of a fitness cliff rather than a gentle slope; a doubly magic nucleus, closed in both N and Z simultaneously, sits at the intersection of two such cliffs and is correspondingly the most sharply peaked point in its neighborhood on the whole chart.
If magic numbers are peaks, the drip lines are the landscape’s outer edge — the boundary past which no further neutrons or protons can be added without the nucleus simply falling apart, one nucleon at a time, faster than any bound state can form. Mapping that boundary is far harder on the neutron-rich side than the proton-rich side, because the nuclei nearest the neutron drip line are also the shortest-lived and hardest to produce in any quantity. As of a 2019 measurement at the RIKEN Radioactive Isotope Beam Factory using the BigRIPS and SAMURAI separator systems, the neutron drip line has been experimentally located only up to the fluorine and neon isotopic chains: fluorine-31 and neon-34 were established as the heaviest bound isotopes of their respective elements, with no bound isotopes found beyond them at those proton numbers [4]. Past neon, the drip line’s exact location for every heavier element remains a theoretical extrapolation rather than an experimental fact — precisely the caveat the 2012 Nature study on nuclear-landscape limits built its uncertainty bars around, noting that different Skyrme energy-density functionals extrapolate the drip line’s exact position differently even when they agree closely within the mapped region [3].

Figure 4. Resolving a magic-number nucleus's extra binding from its neighbours demands the same shielded stability the trap needs to resolve anything at all. — Image prompt and art direction by Brecht Corbeel; generation pending.
Further out still, past the drip lines entirely in the sense of ordinary particle stability, theoretical models predict a second region of enhanced binding among the superheavy elements — the island of stability — centered on a closed neutron shell now generally predicted near N=184, well beyond any neutron number reached by nuclei observed to date. As Yuri Oganessian, who led much of the experimental program that produced the heaviest known elements, and Krzysztof Rykaczewski put it in a 2015 review, current experiments reach only as far as N=177, and “modern theoretical approaches, supported by new experimental data, also point to the existence of long-lived nuclei at and around the magic neutron number N=184” — a prediction, not yet a measurement [8]. The same review is candid about the gap between prediction and observation: some models predict half-lives reaching a million years, or longer, for hypothetical nuclei sitting on that island’s peak, while every superheavy decay chain actually observed so far has terminated in spontaneous fission, with measured half-lives ranging from a fraction of a millisecond to a little over a day. The discovery of element 118 — later named oganesson, symbol Og, by the International Union of Pure and Applied Chemistry in 2016 in recognition of Oganessian’s contributions [14] — was reported in 2006 from the fusion of californium-249 with calcium-48 projectiles at the Joint Institute for Nuclear Research, producing the isotope now known as oganesson-294 through the evaporation of three neutrons from the compound system [7]. Oganesson-294 sits nowhere near the predicted island’s peak; it is a beachhead on its near shore, produced one atom at a time, each one confirmed only by the alpha-decay chain it leaves before undergoing spontaneous fission. The island of stability is, at present, entirely a predicted peak: real in the sense that a well-established theoretical structure predicts it, unreached in the sense that no experiment has weighed a nucleus anywhere near its summit.

Figure 5. A decay chain like uranium-238's fourteen-step walk to lead-206 is a trajectory across the landscape, recorded one recoiling daughter at a time. — Image prompt and art direction by Brecht Corbeel; generation pending.

Figure 6. Past the fluorine-neon frontier and inside the predicted island of stability, the beam a trap is asked to weigh may be a single ion that arrives once and does not arrive again. — Image prompt and art direction by Brecht Corbeel; generation pending.
The analogy holds exactly for one thing and breaks for two others
Stated most narrowly, the part of evolutionary theory’s formal apparatus that maps onto the chart of nuclides without qualification is this: a scalar objective function defined over a discrete state space, together with a rule for what counts as a local move, together with the observation that a system occupying a given state will, given the opportunity, take a move that increases the objective. Binding energy per nucleon is the objective; the (N,Z) lattice is the state space; single beta decay, or the small number of other elementary transitions available at a given point, is the local move. An adaptive walk under strong selection and weak mutation — a population that reliably takes the fitness-increasing step available to it and rarely does anything else — is mathematically the same object as a beta-decay chain descending an isobaric parabola. Basins of attraction exist in both pictures: a beta-stable nuclide is a local optimum that no single beta step can improve on, exactly as a local fitness peak is a state no single mutational step can improve on, and both pictures admit barriers between adjacent basins that a purely local, gradient-following process cannot cross.
That structural identity makes the disanalogy sitting right next to it worth stating carefully, because it is a genuine asymmetry between the two domains rather than a mere difference of degree. Alpha decay and spontaneous fission are not local moves in the sense a single beta step is; they are long-range jumps, from one region of the landscape to another, and in a very large fraction of cases they are classically forbidden — the daughter configuration sits on the far side of an energy barrier the parent nucleus does not have the energy to climb over. The nucleus crosses that barrier anyway, by quantum-mechanical tunneling, at a rate set by the barrier’s height and width rather than by any drift or search process. An evolving population has no equivalent mechanism. A population sitting in a fitness basin, separated from a higher basin by a valley of lower-fitness intermediates, cannot tunnel across that valley; it can only cross by some combination of drift carrying it through low-fitness intermediates, a fortunate large-effect mutation landing it directly in the new basin, or a change in the fitness landscape itself that removes the valley. Nuclei have a move available to them that no population of organisms has: a discrete, barrier-penetrating jump governed by wave mechanics rather than by search through neighboring states. It is worth savoring precisely because it runs in the opposite direction from where such disanalogies usually run — it is not that biology has a richness nuclear physics lacks, but that nuclear physics has a genuinely nonclassical move available to it that biological evolution, built from classical population dynamics, simply does not.
The larger break is more basic and needs no quantum mechanics to state. A nucleus does not reproduce. It does not copy its own configuration, with occasional error, into a next generation of daughter nuclei competing for finite resources against variant configurations produced by other nuclei’s copying errors. There is no population of uranium-238 nuclei in competition with a population of alternative isobars for anything; there is a single uranium-238 nucleus, or a large but non-competing collection of identical ones, and each one, independently, either has or has not yet undergone the same intrinsically random transition, on a timescale set by quantum-mechanical decay probability rather than by relative reproductive success. Selection, in the evolutionary sense, requires heredity, variation, and a differential-reproduction loop connecting the three across generations; a beta-decay chain has none of the three, because it is not a population process at all. It is a sequence of independent single-particle relaxations, each one a single quantum system finding a lower-energy configuration available to it, with no descendant nucleus inheriting anything from the parent’s decay except the parent’s leftover nucleons rearranged into a new configuration. Calling this “selection” without immediately naming that absence would be the sloppy version of the analogy this article is written to avoid; calling it “an adaptive walk on a fitness landscape, minus heredity, minus population, minus a variation-selection loop, plus quantum tunneling across barriers” is the accurate version, and naming exactly which pieces are missing is what makes the comparison useful rather than merely evocative.
There is a further reason the borrowed vocabulary fits with unusual precision here, and it runs backward through the history of the metaphor itself. Sewall Wright introduced the image of a landscape of gene combinations, graded by adaptive value and read by its topography of peaks and valleys, in a 1932 paper to the Sixth International Congress of Genetics. Wright’s own diagram is worth reading in his own words: having reduced an intractably high-dimensional “field of gene combinations” to a two-dimensional contour plot for the sake of illustration, he wrote that “there may be innumerable other peaks which are higher but which are separated by ‘valleys,’” and that “the problem of evolution as I see it is that of a mechanism by which the species may continually find its way from lower to higher peaks” across exactly such a landscape [12]. The mathematical object Wright drew — a single scalar quantity, contoured over a combinatorial space too large to visualize directly except through a reduced two-dimensional slice — is not a biological object first and a physical one by analogy. It is a general mathematical construction, the same one that describes a potential-energy surface in any physical system with more than a few degrees of freedom, applied by a geneticist to a space of gene combinations because no more specific tool existed for the purpose in 1932. Reading it back onto the chart of nuclides, ninety-four years later, is not exporting a biological insight into physics; it is returning a general-purpose mathematical device to a domain where it was always structurally at home; the peaks and valleys of (N,Z)-space were there in the binding-energy data whether or not anyone had a name for the shape they made.
That two-way fit is why the comparison illuminates in both directions rather than only lending nuclear physics some borrowed narrative color. For a reader coming from evolutionary biology, the chart of nuclides is a case where the landscape’s topography, the identity of its peaks, and the exact rule governing local moves can all be stated with a precision no fitness landscape in population genetics has ever achieved, because the underlying physics is completely specified and the relevant “genotype space” has only two dimensions rather than thousands. It is a worked example of exactly what an adaptive walk looks like when the landscape is known exactly, which population genetics almost never has the luxury of assuming. For a reader coming from nuclear physics, forcing the comparison to evolutionary theory’s stricter vocabulary is what makes the missing pieces impossible to gloss over: it takes exactly the discipline of trying to fit uranium-238’s decay chain into the language of populations, heredity, and selection to notice, precisely, that none of the three is present, and that what remains once they are stripped away — a scalar objective, a discrete state space, and a set of local and long-range moves between its points — is the entire content of what the mapping was ever entitled to claim.
Sources
- W. J. Huang, M. Wang, F. G. Kondev, G. Audi, S. Naimi. The AME 2020 atomic mass evaluation (I). Evaluation of input data, and adjustment procedures. Chinese Physics C (2021). DOI: 10.1088/1674-1137/abddb0.
- F. G. Kondev, M. Wang, W. J. Huang, S. Naimi, G. Audi. The NUBASE2020 evaluation of nuclear physics properties. Chinese Physics C (2021). DOI: 10.1088/1674-1137/abddae.
- J. Erler, N. Birge, M. Kortelainen, W. Nazarewicz, E. Olsen, A. M. Perhac, M. Stoitsov. The limits of the nuclear landscape. Nature (2012). DOI: 10.1038/nature11188.
- D. S. Ahn, N. Fukuda, H. Geissel, N. Inabe, N. Iwasa, T. Kubo, K. Kusaka, D. J. Morrissey, D. Murai, T. Nakamura, M. Ohtake, H. Otsu, H. Sato, B. M. Sherrill, Y. Shimizu, H. Suzuki, H. Takeda, O. B. Tarasov, H. Ueno, Y. Yanagisawa, K. Yoshida. Location of the Neutron Dripline at Fluorine and Neon. Physical Review Letters (2019). DOI: 10.1103/PhysRevLett.123.212501.
- Maria G. Mayer. On Closed Shells in Nuclei: II. Physical Review (1949). DOI: 10.1103/PhysRev.75.1969.
- O. Haxel, J. H. D. Jensen, H. E. Suess. On the "Magic Numbers" in Nuclear Structure. Physical Review (1949). DOI: 10.1103/PhysRev.75.1766.2.
- Yu. Ts. Oganessian, V. K. Utyonkov, et al.. Synthesis of the isotopes of elements 118 and 116 in the 249Cf and 245Cm+48Ca fusion reactions. Physical Review C (2006). DOI: 10.1103/PhysRevC.74.044602.
- Yuri Ts. Oganessian, Krzysztof P. Rykaczewski. A beachhead on the island of stability. Physics Today (2015). DOI: 10.1063/PT.3.2880.
- R. X. Schüssler, H. Bekker, M. Braß, et al.. Detection of metastable electronic states by Penning trap mass spectrometry. Nature (preprint via arXiv) (2020).
- Klaus Blaum. High-accuracy mass spectrometry with stored ions. Physics Reports (2006). DOI: 10.1016/j.physrep.2005.10.011.
- C. F. v. Weizsäcker. Zur Theorie der Kernmassen. Zeitschrift für Physik (1935). DOI: 10.1007/BF01337700.
- Sewall Wright. The Roles of Mutation, Inbreeding, Crossbreeding and Selection in Evolution. Proceedings of the Sixth International Congress of Genetics (1932).
- M. P. Fewell. The atomic nuclide with the highest mean binding energy. American Journal of Physics (1995). DOI: 10.1119/1.17828.
- International Union of Pure and Applied Chemistry. IUPAC Announces the Names of the Elements 113, 115, 117, and 118. IUPAC (2016).
Originally published at https://absolutedigitalpublishers.com/articles/the-valley-of-stability-is-a-fitness-landscape.