Reading the Claude Fable 5.1 Scorecard
Anthropic's own numbers for Claude Fable 5.1, checked against each benchmark's own home page, the effort settings the announcement discloses, and what nobody outside Anthropic had independently reproduced by launch's end.
The scorecard is produced here — a harness running scripted tasks against a pinned model, not a leaderboard that exists on its own. — Image prompt and art direction by Brecht Corbeel; image generated to that direction.
Abstract
This article reads the Claude Fable 5.1 and Claude Mythos 5.1 launch scorecard the way a reader should on day one: every number checked against Anthropic's own announcement page, every benchmark's meaning checked against that benchmark's own documentation rather than Anthropic's gloss on it, the effort settings the announcement discloses (and the ones it does not) laid out plainly, the applied-science claims in protein design, molecular binding, Venus radar mapping and GPU kernel optimization examined on their own terms, and the state of independent, third-party replication as of launch day — which, as of this writing, is none. It stays off the launch narrative, access tiers, API pricing and safety measures covered elsewhere in this series and stays entirely on the scorecard itself.
Anthropic put a scorecard in front of the press today, 1 September 2026, alongside Claude Fable 5.1 and Claude Mythos 5.1: seven named benchmarks, a set of applied-science results in protein design, molecular biology, planetary radar and GPU optimization, and a claim to lead Fable 5, Opus 5 and OpenAI’s GPT-5.6 Sol across most of them [1]. The launch narrative, the access-tier split between Fable and Mythos, the API pricing mechanics, and the safety changes are covered elsewhere in this series. This piece does one narrower thing: it reads the scorecard the way a reader should read any vendor’s own numbers on the day they are published — checking each figure against the page that reports it, checking what each benchmark actually measures against that benchmark’s own documentation rather than Anthropic’s summary of it, laying out which effort setting a number was run at where the announcement says so, and being honest about what nobody outside Anthropic has yet independently reproduced.
The headline table, as Anthropic reports it
Every figure below is quoted directly from Anthropic’s own announcement page, verified today [1]. Nothing here is estimated or interpolated.
- Benchmark — Fable 5.1 — Fable 5 — Opus 5 — GPT-5.6 Sol
- Terminal-Bench-Science 0.1 — 52.6% — 24.7% — 29.0% — 22.4%
- Terminal-Bench 4.0 — 55.8% — 42.0% — 52.3% — 37.3%
- GDPval-AA v2 (Elo) — 1853 — 1723 — 1824 — 1711
- OSWorld 2.0, partial — 77.9% — 72.9% — 75.4% — —
- OSWorld 2.0, strict — 41.7% — 36.1% — 39.6% — —
- Humanity’s Last Exam, no tools — 60.9% — 57.8% — 56.6% — —
- Humanity’s Last Exam, with tools — 65.0% — 63.8% — 63.6% — —
- AutomationBench — 31.4% — 17.1% — 26.9% — 19.6%
- CursorBench 3.2.0 — 73.4% — 70.5% — 70.0% — 67.2%
Anthropic reports Terminal-Bench 4.0 is a separate lead for Claude Mythos 5.1 specifically, at 60.9%, above Fable 5.1’s 55.8% and Mythos 5’s 42.0% [1]. That distinction matters for the access-tier story this series covers separately, but not for the scorecard itself: it is the same benchmark, the same task set, a different safeguard configuration.
Read across the row, Fable 5.1 leads on every benchmark Anthropic chose to report against GPT-5.6 Sol, and leads Opus 5 on six of the seven comparisons where Opus 5 appears — the one exception being Terminal-Bench 4.0, where Mythos 5.1 rather than Fable 5.1 is the model that overtakes Opus 5’s 52.3%. None of that is surprising on its own: a lab does not typically publish a scorecard where its newest model loses. What is worth doing is opening each benchmark’s own front door and checking whether the number means what the announcement implies it means.
Terminal-Bench-Science: a young, narrow benchmark with a low ceiling
Terminal-Bench-Science 0.1 is not Anthropic’s benchmark. It is hosted by Stanford University, Harbor and the Laude Institute, built as an extension of the broader Terminal-Bench project that Anthropic, OpenAI and Google DeepMind have all adopted for agentic evaluation [2]. Its first release, published in 2026, contains 70 tasks spanning life, physical, Earth, mathematical and engineering sciences — data analysis, simulation, optimization and theorem-proving pulled directly from practicing scientists’ own workflows, graded on concrete artifacts against reproducible tests rather than multiple-choice answers [3].
That context reframes the headline 52.6% figure. Terminal-Bench-Science’s own launch page reports that the strongest model evaluated at the benchmark’s debut, Claude Opus 5 running inside Claude Code, resolved 30% of its 70 tasks — meaning the ceiling this benchmark had established before Fable 5.1 shipped was 30 tasks out of 70 [3]. Anthropic’s own announcement states the standard error on these scores runs ±3.5 to 4.5 points per model — wide enough that a handful of tasks either way moves the reported percentage by several points [1]. A 70-task benchmark in its first point release, with error bars that size and a field still clustered under a third of tasks resolved a few months ago, is a real and useful signal about a fast-moving frontier — not yet a mature, saturated instrument the way older coding benchmarks have become. The size of the reported jump, more than double the previous Fable generation’s score, is consistent with a benchmark still early enough that consecutive model generations can move it by that much; it is not on its own evidence that the underlying capability gap is that large in absolute terms.
Terminal-Bench 4.0 and CursorBench: coding agents graded by two different harnesses
Terminal-Bench 4.0, the mainline version of the same Stanford/Harbor/Laude project, evaluates agents against a broader and more mature suite of terminal-based coding and system tasks, with results presented alongside statistical confidence intervals and tracked across cost and token usage as well as raw resolution [2]. Fable 5.1’s reported 55.8% against Fable 5’s 42.0% and Opus 5’s 52.3% [1] sits inside a benchmark old enough to carry that kind of instrumentation, which is a meaningfully different evidentiary position than Terminal-Bench-Science’s 70-task debut set.
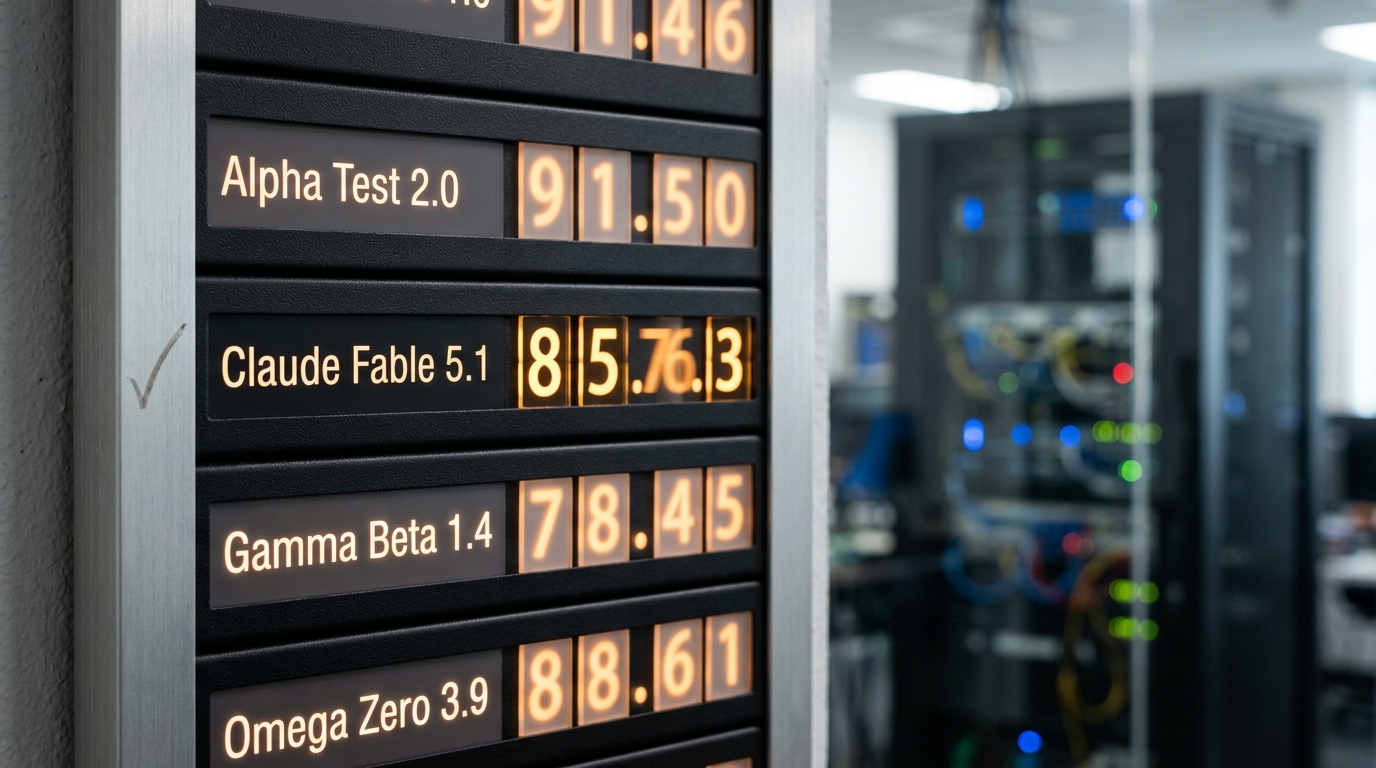
Figure 1. Terminal-Bench 4.0 and CursorBench 3.2.0 both put Fable 5.1 ahead of Opus 5 and Fable 5 — but a vendor's own harness chose the effort level the number was run at. — Image prompt and art direction by Brecht Corbeel; image generated to that direction.
CursorBench 3.2.0 is a different instrument again, built by Cursor from tasks collected out of real Cursor sessions rather than constructed test cases — deliberately ambiguous, multi-file problems meant to test agentic, repo-aware coding rather than isolated completion, with version 3.2 specifically adding instruction-following and advanced tool-use problems on top of the edit/refactor/bugfix and codebase-understanding tasks earlier versions introduced [9]. Cursor’s own documentation for the benchmark includes a caveat that Anthropic’s press page does not repeat: “small differences in scores may not be statistically meaningful” [9]. Fable 5.1’s reported 73.4% against Opus 5’s 70.0% and GPT-5.6 Sol’s 67.2% [1] is a real lead by the benchmark’s own numbers, but the gap between Fable 5.1 and Fable 5 — 73.4% against 70.5%, under three points — is inside the range Cursor itself warns may not be a meaningful difference on this particular instrument, even though the wider gap against Fable 5 on Terminal-Bench-Science almost certainly is.
OSWorld 2.0: two very different numbers from the same tasks, and a safeguard footnote
OSWorld was built by researchers at the University of Hong Kong, Salesforce Research, Carnegie Mellon University and the University of Waterloo as a real desktop-environment benchmark: agents operate an actual Ubuntu, Windows or macOS environment across 369 tasks spanning arbitrary applications and multi-application workflows, graded by execution-based evaluation scripts rather than by an LLM judge [4]. The gap this benchmark was built to expose is real and large — the project’s own reporting notes that human operators complete over 72% of its tasks while, at an earlier point in the benchmark’s life, the best-performing model managed only about 12% [4]. That is the honest baseline context for reading any current score on it: OSWorld measures something models have historically been bad at, and a jump from roughly 73% to roughly 78% on the “partial” scoring mode is a jump within a regime that has moved a long way in a short time, not evidence the task is solved.
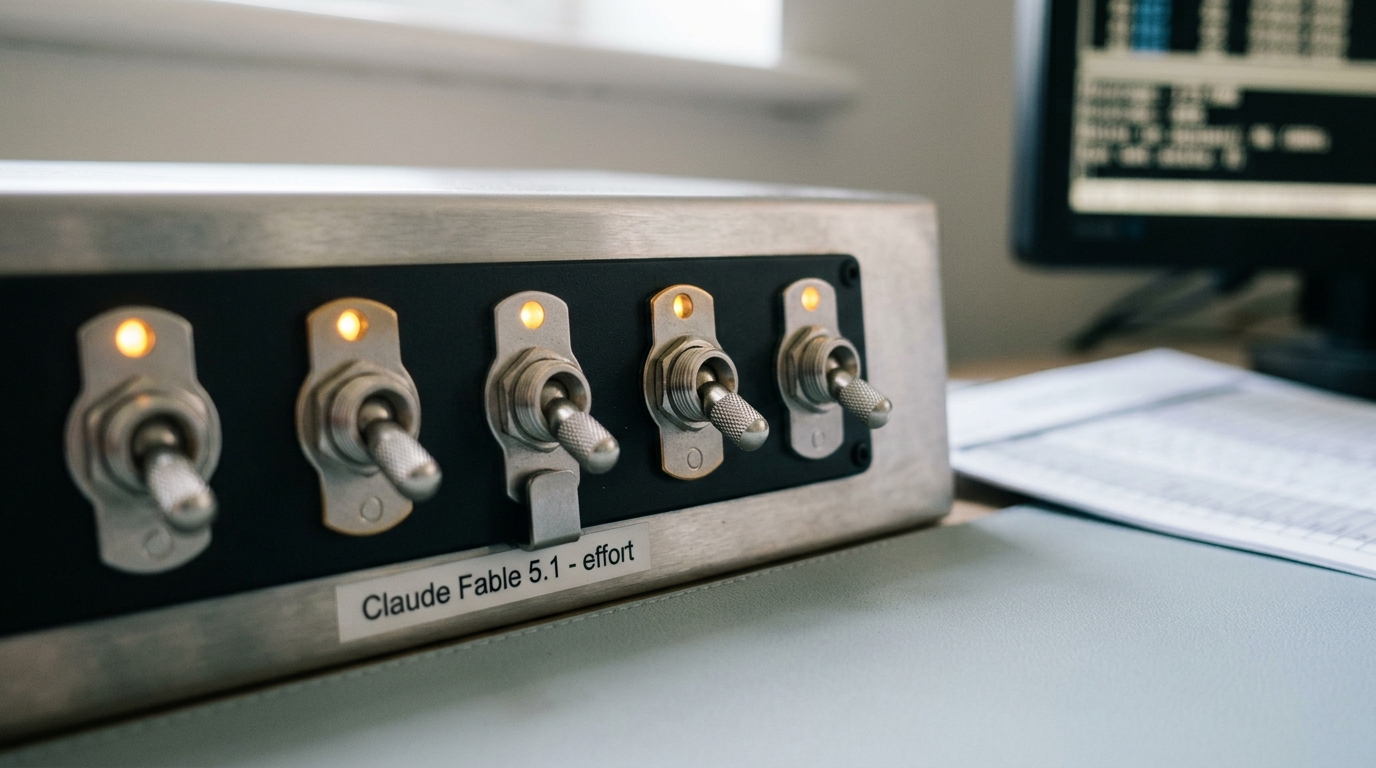
Figure 2. Anthropic's own page states some benchmarks at one fixed effort and others swept across low, medium, high, xhigh and max — the setting changes the number, and not every table says which one was used. — Image prompt and art direction by Brecht Corbeel; image generated to that direction.
The partial/strict distinction Anthropic reports — 77.9% partial versus 41.7% strict for Fable 5.1, and comparable roughly-two-to-one gaps for Fable 5 and Opus 5 [1] — is not something OSWorld’s own top-level documentation frames in those exact terms; it appears to be Anthropic’s own scoring cut of the underlying task suite, which is a legitimate thing for a lab to report but worth naming as such rather than treating as a canonical OSWorld metric with a fixed, externally agreed definition. What is unambiguously worth reproducing here is the caveat Anthropic’s own page discloses about this exact benchmark: on tasks where the model’s safeguards intervened, both Fable 5.1 and Fable 5 scored a zero, and separately, tasks that were redirected to other Anthropic models entirely — cybersecurity tasks completed by Claude Opus 4.8, biology tasks completed by Claude Opus 5 — were excluded from the scoring rather than counted [1]. Both of those are reasonable methodological choices for a lab genuinely trying to measure one model’s task-completion ability without conflating it with its own safety refusals. They are also choices that shape the number, and a reader comparing this figure against a different vendor’s OSWorld run should know they exist before assuming the two numbers were produced the same way.
Humanity’s Last Exam: a hard, narrow, still-unsaturated test — and only two effort settings disclosed
Humanity’s Last Exam was built by the Center for AI Safety and Scale AI with roughly a thousand subject-matter experts across more than 500 institutions and 50 countries, assembling 2,500 closed-ended questions across more than a hundred subjects specifically because older benchmarks had become saturated, with frontier models clearing 90% or more; HLE was designed to stay hard [5]. It also grades calibration, not just accuracy — models report a confidence level alongside each answer, and the benchmark can separately assess whether that confidence is trustworthy [5].
Anthropic’s announcement page states Fable 5.1 was evaluated on HLE at both “low” and “max” effort [1] — a detail worth sitting with, because it is one of exactly two disclosed data points on a five-level effort scale the same page describes elsewhere (low, medium, high, xhigh, max). The reported 60.9% without tools and 65.0% with tools [1] are, by the page’s own disclosure, drawn from the top of that scale rather than a default or median setting, and the announcement does not state which of “low” or “max” produced which of the two reported figures. A reader cannot, from what Anthropic has published, reconstruct what Fable 5.1 scores on HLE at a setting closer to what a typical API call would actually run at by default.
GDPval-AA v2: an Elo score anchored to a human baseline, not a raw pass rate
GDPval itself is OpenAI’s benchmark, built with industry professionals averaging fourteen years of experience across 44 occupations in the nine sectors that contribute most to U.S. GDP, evaluated by blind expert comparison against real deliverables — legal briefs, financial analyses, engineering documents — rather than abstract question-answering [7]. GDPval-AA v2, the specific variant Anthropic cites, is Artificial Analysis’s own independent evaluation framework built on top of that dataset: rather than reporting the pass/fail or better/worse/tie rate OpenAI’s original methodology used directly, Artificial Analysis converts blind pairwise comparisons into an Elo rating anchored to a human baseline of 1,000 [6]. That makes 1853 a relative rating, not a percentage of tasks completed or a score out of some fixed maximum — it says Fable 5.1 was judged, in head-to-head blind comparisons run by Artificial Analysis, to produce better deliverables than a 1,000-rated human baseline by roughly the margin an 850-point Elo gap implies, and to sit ahead of Opus 5’s 1824 and Fable 5’s 1723 [1] [6]. GDPval’s own documentation is candid about where a benchmark like this is weakest: expert judgment of “better” work is inherently somewhat subjective, professionals disagree about what representative work even looks like within one role, and the whole exercise necessarily excludes everything about a real job that is not a single discrete deliverable — meetings, relationship-building, the informal parts of actually doing knowledge work [7].
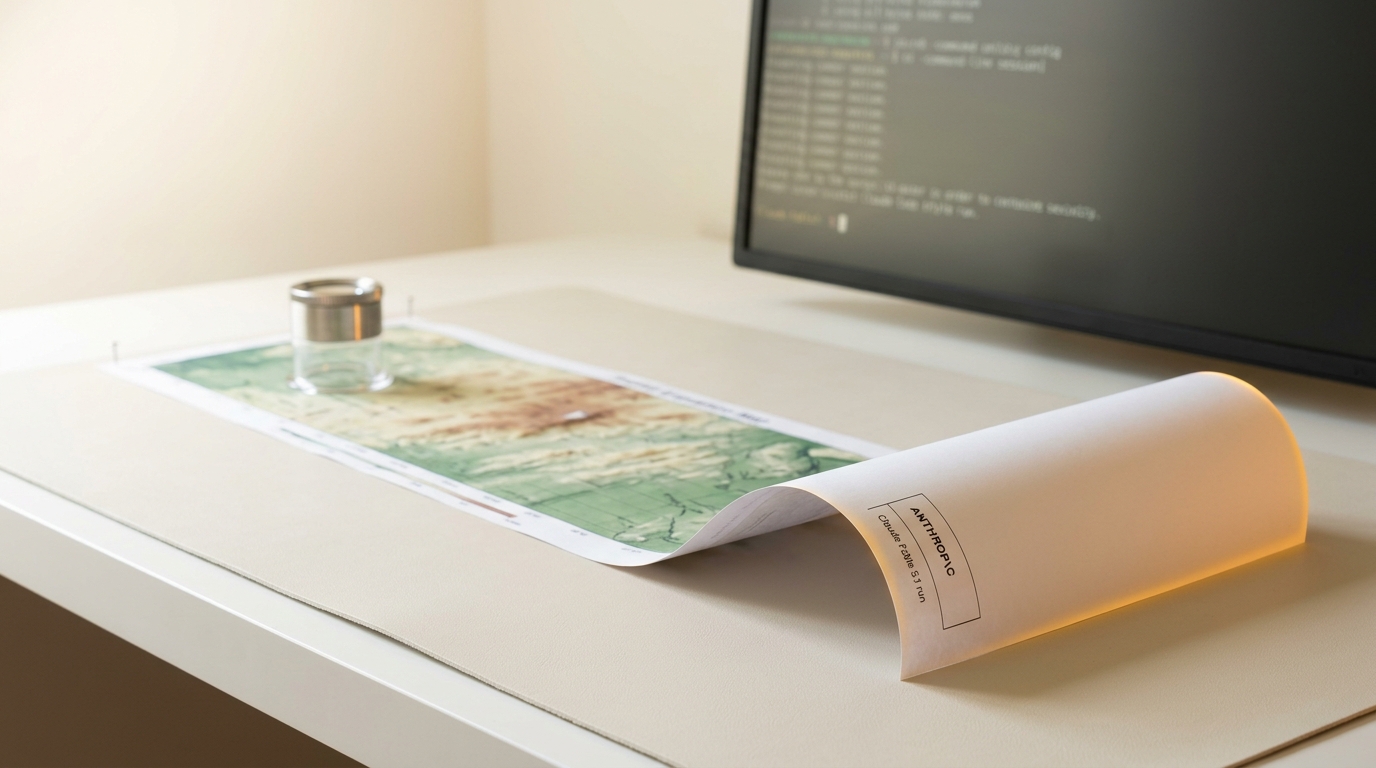
Figure 3. Applied-science claims sit outside any leaderboard entirely — a radar-mapping resolution gain from roughly 10-20 km to 2-3 km footprint is a physical-science result, not a benchmark score. — Image prompt and art direction by Brecht Corbeel; image generated to that direction.
AutomationBench: a much younger benchmark, and a big jump worth treating carefully
AutomationBench, built by Zapier, evaluates agents on cross-application business workflows — CRM, inbox, calendar and messaging systems together — graded end-to-end on whether the correct data ends up in the correct system rather than on how the agent got there, with 600 public tasks across sales, marketing, operations, support, finance and HR plus a held-out private set for the official leaderboard [8]. Fable 5.1’s reported 31.4% against Fable 5’s 17.1% and Opus 5’s 26.9% [1] is, on its face, the single largest proportional jump on Anthropic’s entire scorecard — Fable 5.1 nearly doubles its predecessor’s score. It is also, by a wide margin, the newest and least-established benchmark on the list, and Zapier’s own repository frames it explicitly as a young project still being refined rather than a mature, widely-adopted standard [8]. A near-doubling on a young benchmark deserves the same treatment as Terminal-Bench-Science’s jump: plausible given how early the instrument is, and not yet something with the track record to weight as heavily as a multi-generation-old benchmark’s more modest movement.
What “effort” means here, and why the announcement’s own disclosure is uneven
Anthropic’s page names five effort levels — low, medium, high, xhigh and max — and states plainly that Terminal-Bench 4.0 and CursorBench 3.2.0 were assessed across that full range, while Terminal-Bench-Science 0.1 defaults to high effort inside Claude Code and medium inside Claude Cowork and on claude.ai, and HLE was run at only low and max [1]. OSWorld 2.0’s partial/strict split is a scoring-mode distinction, not an effort-level one, and the announcement does not state which effort level(s) produced the OSWorld or GDPval-AA v2 numbers at all. That unevenness is the single most important thing a critical reader should take from the effort-setting disclosure: on the benchmarks where Anthropic swept the full range, a reader at least knows the headline figures could be the top of a five-point spread rather than a typical result; on the benchmarks where the page is silent on effort, or discloses only two of five levels as it does for HLE, there is simply no way to know from the published page alone whether the reported score represents what a default API call would produce.
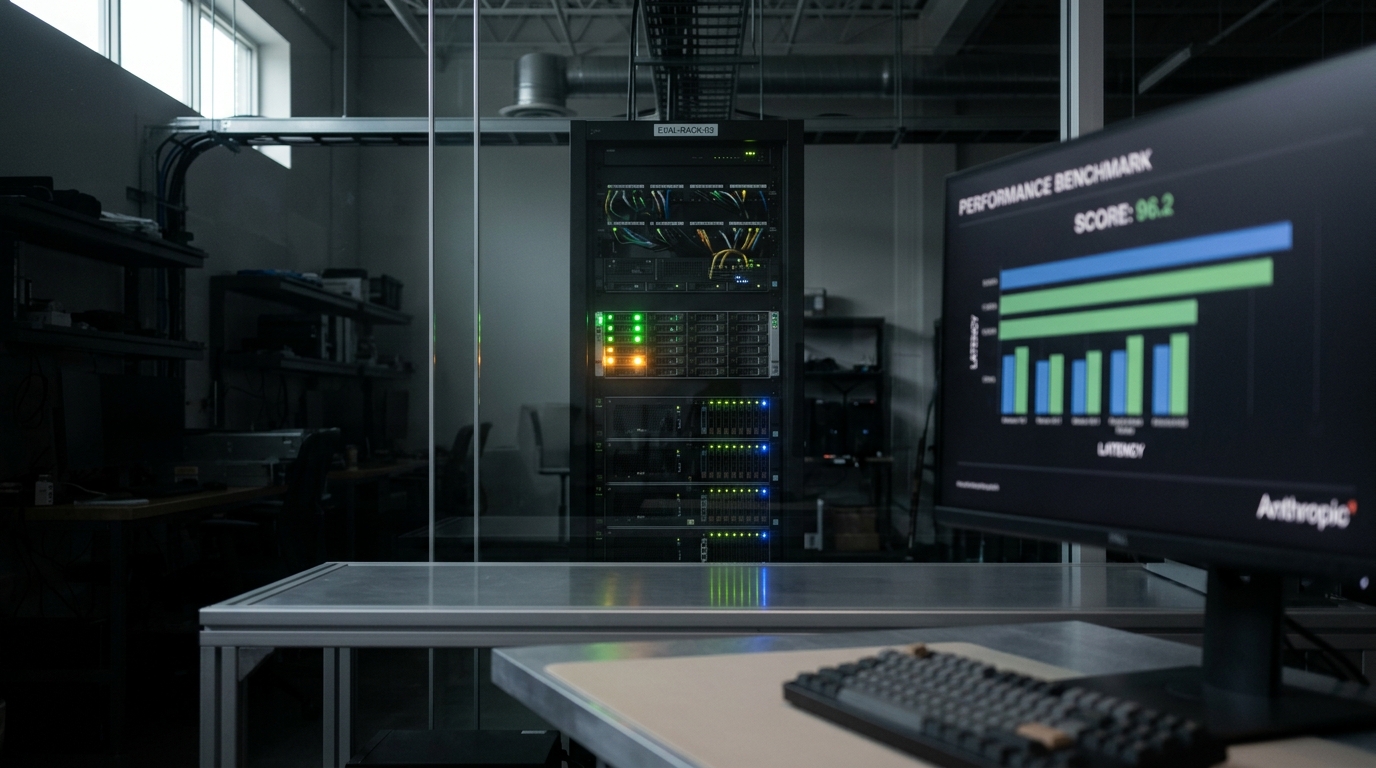
Figure 4. Fable 5.1's GPU-kernel work reports 1.4-2.5x speedups and 30-60% estimated cost savings on genome-wide analyses — a claim about optimizing someone else's code, tested on Anthropic's own account of it. — Image prompt and art direction by Brecht Corbeel; image generated to that direction.
The applied-science claims: outside any leaderboard, and worth reading on their own terms
Four results in Anthropic’s announcement sit entirely outside the benchmark table and deserve to be read as a separate category, because nothing about them is graded by a public leaderboard. In protein-binder design, Anthropic reports hit rates near 50% across 12 target proteins, against typical industry hit rates the announcement puts at 10-15% [1]. In molecular binding, the announcement reports affinities roughly ten times stronger than the best submitted designs in Adaptyv Bio competitions, on three specific targets [1]. In Venus radar mapping, working from NASA’s Magellan mission imagery, the announcement reports elevation-mapping resolution improved from a roughly 10-20 kilometer footprint to a 2-3 kilometer footprint, with up to 25% better height accuracy [1]. And in GPU kernel optimization across seven open-source deep-learning frameworks, the announcement reports speedups of 1.4 to 2.5 times on NVIDIA H100 hardware, with an estimated 30-60% reduction in compute cost on genome-wide analyses specifically [1].
These are, by nature, harder for an outside reader to check than a named benchmark score: there is no public Terminal-Bench-style leaderboard for Venus radar resolution or Adaptyv Bio binding affinity that a third party can rerun against a held-out task set. They read as case studies Anthropic selected and reports in its own words, not as entries on an instrument anyone else controls. That does not make them false — a 10x binding-affinity improvement against a named competition’s actual submitted entries, if accurately described, is a specific and checkable claim in principle — but it does mean they carry a different evidentiary weight than a benchmark score run on a public task set with a public leaderboard, and a reader should hold that distinction rather than folding a self-reported laboratory result into the same mental bucket as a Terminal-Bench percentage.
Independent replication, as of today: none
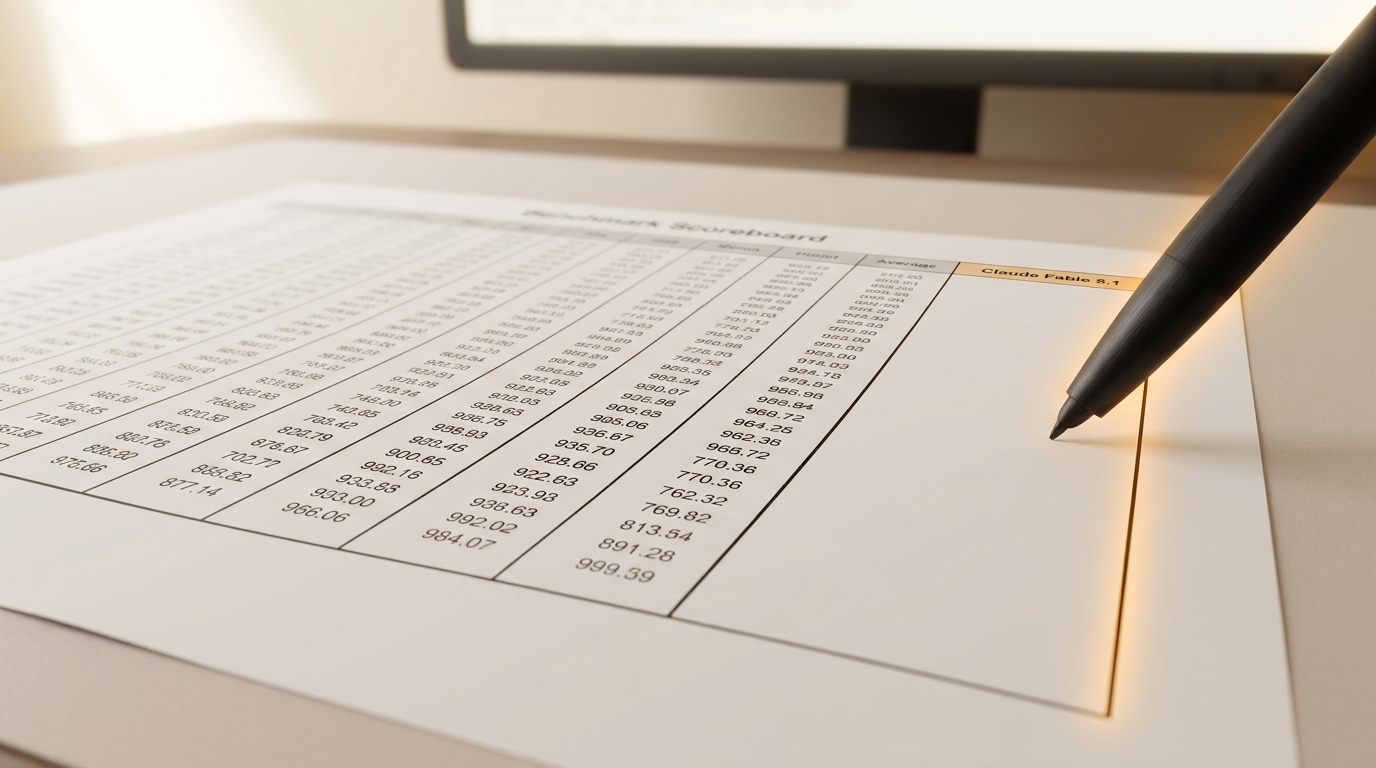
Figure 5. On launch day, every number on the sheet still traces back to one source — Anthropic's own harness. The independent-replication column is the one still empty. — Image prompt and art direction by Brecht Corbeel; image generated to that direction.
As of this writing on launch day, every number in this article traces back to one source: Anthropic’s own announcement page and the benchmark harnesses Anthropic itself ran. Coverage published today by outlets including MacRumors reproduces the headline figures without independent testing, additional context, or any stated attempt to verify them against a separately run harness [10]. VentureBeat’s own launch-day coverage is more explicit about this exact gap, stating plainly that Anthropic’s benchmark figures “should be read as vendor-reported results rather than independent proof of superiority,” and separately noting that Anthropic’s own page carries qualifications about production safeguards affecting scores and about its OSWorld task release not being directly comparable to some previously published results [11]. That same VentureBeat piece points to the customer testimonials included in Anthropic’s launch materials — a firm tracing a rare software bug, another running an unattended 38-hour machine-learning job — as arguably more useful anecdotal signal than the benchmark table, while being careful to note that those, too, are testimonials supplied by Anthropic as part of its own launch, not independently reproduced results [11].
None of the benchmark operators named on this scorecard — the Terminal-Bench project, the OSWorld team, the Humanity’s Last Exam collaborators, or Artificial Analysis for GDPval-AA v2 — had, as of today, published their own independently-run evaluation of Fable 5.1 or Mythos 5.1 that this article could locate and verify. Terminal-Bench, OSWorld and Artificial Analysis all maintain public leaderboards that are periodically updated with results those organizations run themselves rather than accept from vendor press pages; whether Fable 5.1’s reported figures survive being rerun on one of those independently-operated leaderboards is a genuinely open question on day one, and it is the single most useful thing a reader can watch for over the days following this launch, rather than a question this article, sourced entirely from material published today, can answer.
Reading the scorecard, in sum
None of the above is an argument that Fable 5.1’s reported numbers are wrong. Every figure quoted here matches what Anthropic’s own page states, and several of the benchmarks involved — Terminal-Bench 4.0 in particular, and to a lesser degree CursorBench and HLE — are mature enough, and instrumented with wide enough external adoption, that a large reported gain is a real thing to take seriously. The argument is narrower: a self-reported scorecard published on the day of a launch is one lab’s account of its own model, run on its own hardware, under effort settings it partly discloses and partly does not, against comparison figures it chose to include, with the newest and largest-swinging numbers concentrated on the youngest and least-established benchmarks in the set. That is not a flaw unique to Anthropic — it is the structural position every vendor’s own launch-day numbers occupy, on every launch, from every lab. The honest way to hold a scorecard like this one is to take the parts that are checkable against a mature, third-party-maintained instrument seriously, treat the parts that are Anthropic’s own framing of a young benchmark or an unreplicated laboratory result as plausible but unverified, and wait for the specific thing that turns a vendor’s scorecard into an established fact: someone else running the same tasks.
Sources
- Anthropic. Introducing Claude Fable 5.1 and Claude Mythos 5.1. Anthropic (2026).
- Stanford University, Harbor, Laude Institute. Terminal-Bench. tbench.ai (2026).
- Stanford University, Terminal-Bench team. Terminal-Bench-Science 0.1. tbench.ai (2026).
- Xie, T., Yu, T., et al. (HKU, Salesforce Research, CMU, University of Waterloo). OSWorld. osworld-v1.xlang.ai (2026).
- Center for AI Safety, Scale AI. Humanity's Last Exam. lastexam.ai (2026).
- Artificial Analysis. GDPval-AA v2 Leaderboard. Artificial Analysis (2026).
- Transformer News. OpenAI's GDPval benchmark measures when AI can do your job. Transformer News (2026).
- Zapier. AutomationBench: A benchmark for evaluating AI agents on realistic business workflows. GitHub (2026).
- Cursor. CursorBench. Cursor (2026).
- MacRumors. Anthropic Launches Claude Fable 5.1 With Lower Costs and Fewer False Positives. MacRumors (2026).
- VentureBeat. Anthropic's Claude Fable 5.1 and Mythos 5.1 arrive with a 75% cost reduction for Fable cache reads. VentureBeat (2026).
Originally published at https://absolutedigitalpublishers.com/articles/reading-the-claude-fable-5-1-scorecard.