Materials Discovery and Degradation in Practice: An Advanced Technical Guide
What it actually takes to characterize a new material, age it on purpose, and cycle a battery to death in a way regulators and reviewers will accept.
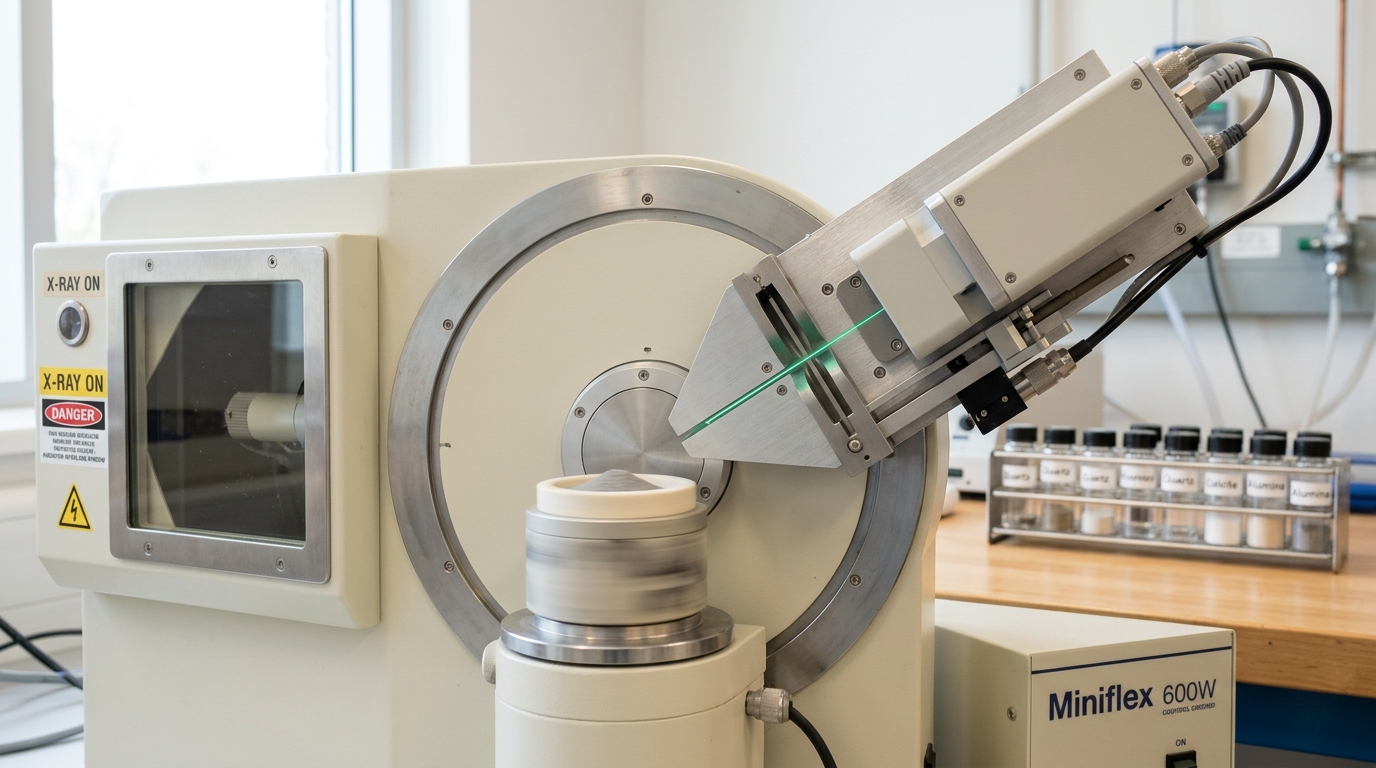
A powder pattern is built one angle at a time; the peak that will define the phase is still arriving as the goniometer arm sweeps past it. — Image prompt and art direction by Brecht Corbeel; generation pending.
Abstract
Characterizing a new material is not a single measurement but a chain of instruments, each with its own failure modes: powder X-ray diffraction and electron microscopy establish structure at incompatible length scales, accelerated-aging chambers compress years of exposure into weeks at the cost of activating mechanisms the field never sees, and battery cyclers turn a chemical question into a statistical one across hundreds of cells. This guide walks through what a materials lab actually does bench to bench — structural characterization, corrosion and polymer aging protocols, cycle-life testing, semiconductor reliability qualification, and the autonomous synthesis robots now closing part of that loop — and is explicit about where each method's numbers stop meaning what a vendor slide implies they mean.
What “characterizing a material” actually means
A vendor slide can say a new alloy, polymer, or electrode compound “outperforms” an incumbent in one line. Getting to that line, if it is done honestly, means running the candidate through several instruments that see it at different length scales, under different conditions, and answering different questions — and none of them, alone, tells you whether the material will survive its intended service life. This guide walks the actual bench sequence: structural characterization by X-ray diffraction and electron microscopy, accelerated-aging protocols for corrosion and polymer degradation, cycle-life testing for batteries, reliability qualification for semiconductor packages, and the autonomous synthesis robots now automating parts of that sequence. At each stage the goal is to separate what the instrument actually measured from what a reasonable person might assume it measured.
Structure first: what a diffraction pattern can and cannot tell you
Powder X-ray diffraction (XRD) is usually the first structural measurement run on a new crystalline material, because it is fast, non-destructive, and statistically representative — a powder sample presents billions of randomly oriented crystallites to the beam, and the resulting pattern of peak positions and intensities is a fingerprint of the unit cell and its symmetry. Peak positions locate the lattice through Bragg’s law,
n\lambda = 2d\sin\theta,
where \lambda is the known X-ray wavelength, d is the spacing between a family of lattice planes, and \theta is half the scattering angle at which a peak appears. Peak positions alone give the lattice parameters; peak intensities and shapes carry the rest of the story, and that is where the real work is.
Modern practice fits the whole pattern simultaneously — peak positions, intensities, widths, and background — against a structural model, a procedure called Rietveld refinement. Software packages such as GSAS-II implement this as a nonlinear least-squares problem that minimizes the weighted residual between an observed and a calculated pattern across every measured point [6]. Refinement quality is reported as a weighted profile R-factor,
R_{wp} = \sqrt{\frac{\sum_i w_i \left(y_i^{\mathrm{obs}} - y_i^{\mathrm{calc}}\right)^2}{\sum_i w_i \left(y_i^{\mathrm{obs}}\right)^2}},
alongside a goodness-of-fit statistic that compares R_{wp} to the value expected from counting statistics alone. A low R_{wp} is necessary but not sufficient evidence of a correct structure: a wrong space group with enough adjustable parameters can still fit a pattern well, which is why practitioners cross-check refined models against known chemistry, bond-valence sums, and, wherever possible, an independent technique.
That independent technique is usually electron microscopy, and the two methods are complementary rather than redundant precisely because they disagree about scale. Powder XRD reports an ensemble average over a macroscopic sample volume; it cannot see a single defect, a minority second phase present below a few percent, or the real-space arrangement of atoms at an interface. Transmission electron microscopy (TEM) does the opposite: it images or diffracts from a single, electron-transparent region of a specimen typically under 100 nanometers thick, giving real-space and reciprocal-space information at near-atomic resolution, but from a volume that may not represent the bulk at all. A grain that looks perfectly ordered under the microscope may sit next to a defective region the microscope never sampled; a bulk diffraction pattern that looks single-phase may be hiding a second phase distributed as nanoscale precipitates the powder measurement averages away.
Getting a specimen into the microscope is itself a nontrivial procedure. Thinning by ion milling, electropolishing, or focused-ion-beam lift-out can introduce artifacts — amorphized surface layers, redeposited material, or preferential thinning of one phase — that are easy to mistake for the material’s real microstructure if the practitioner has not characterized the preparation method’s own signature. Getting the specimen rod into the column safely, at working vacuum, without contaminating the gun chamber, is a slower and more procedural step than the imaging itself, and rushing it is a common source of lost specimens and downtime.
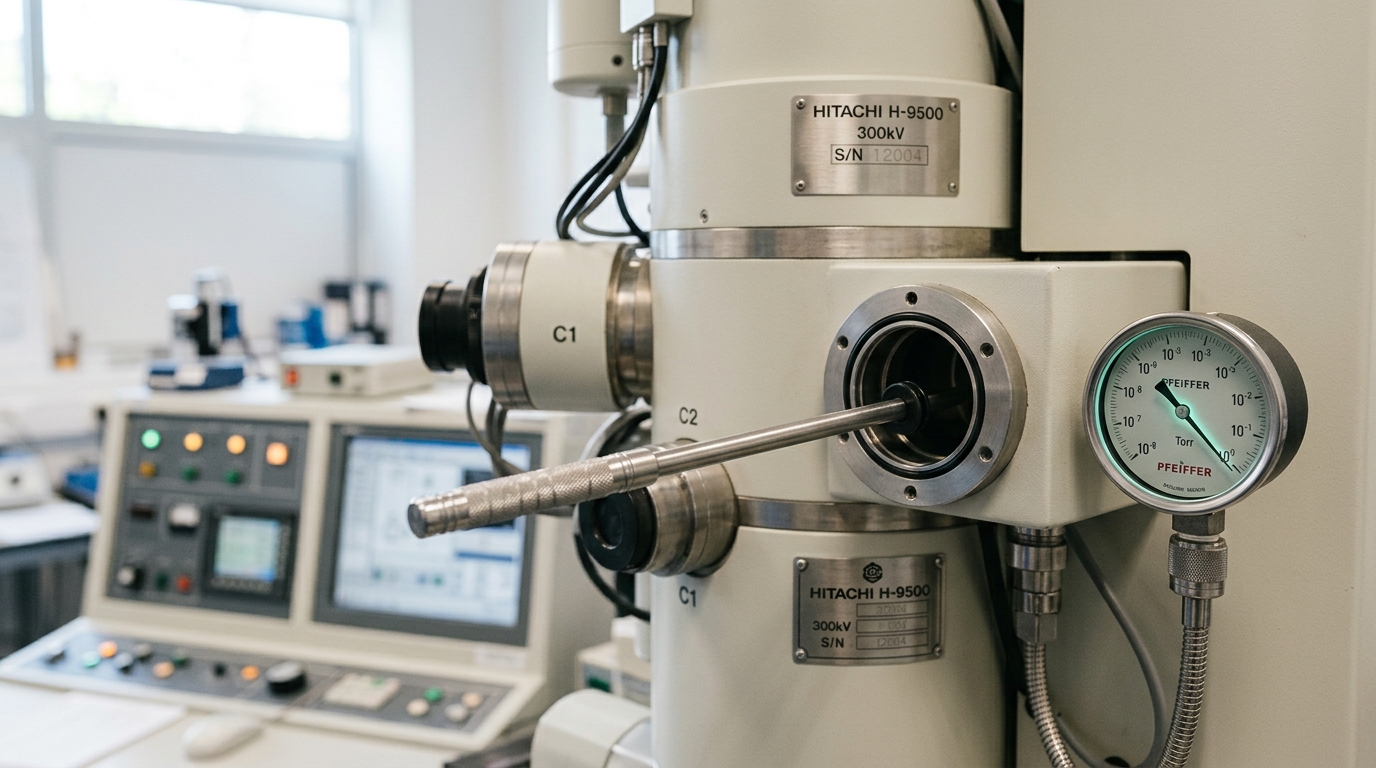
Figure 1. Between a diffraction pattern and a lattice image sits a specimen thin enough for electrons to pass through it, and getting one there is most of the work. — Image prompt and art direction by Brecht Corbeel; generation pending.
The honest summary: XRD tells you what phases are present and roughly how much of each, averaged over a macroscopic volume, with a precision that depends on how carefully the refinement was checked against chemistry. TEM tells you what a specific, small region actually looks like in real space, with a representativeness that depends entirely on where the sample happened to come from. A single instrument’s output presented as “the structure” of a new material, without the other, is an incomplete claim — and an increasingly common failure mode in less careful reporting is quoting a Rietveld R_{wp} as if it were proof of phase purity, when it is a statement about fit quality against one assumed model.
Accelerated aging: compressing years into weeks, and what that compression costs
Corrosion and polymer degradation are slow under service conditions — which is exactly why almost no qualification program can wait for real-time results. Accelerated-aging protocols raise temperature, humidity, UV dose, or corrosive-species concentration to compress years of exposure into weeks, on the assumption that the same degradation mechanism simply runs faster. That assumption is the entire risk in accelerated testing, and it fails more often than marketing materials imply.
The most widely used corrosion screening protocol, ASTM B117, exposes coated or bare metal specimens to a continuous salt fog — a 5% sodium chloride solution at pH 6.5–7.2, held in a chamber at 35°C — for a specified duration, then scores visible corrosion [3]. It is cheap, fast, and highly repeatable, which is why it remains standard across automotive, aerospace, and consumer-electronics qualification. It is also a poor proxy for most real environments: continuous wetting at constant temperature does not reproduce the wet–dry cycling, temperature swings, UV exposure, and pollutant chemistry of an actual coastal or de-icing-salt environment, and coatings are known to rank differently under B117 than they do in field exposure. A part that “passes” 500 hours of salt fog has demonstrated resistance to one specific accelerated condition, not a guarantee about field life — a distinction vendor datasheets routinely blur.
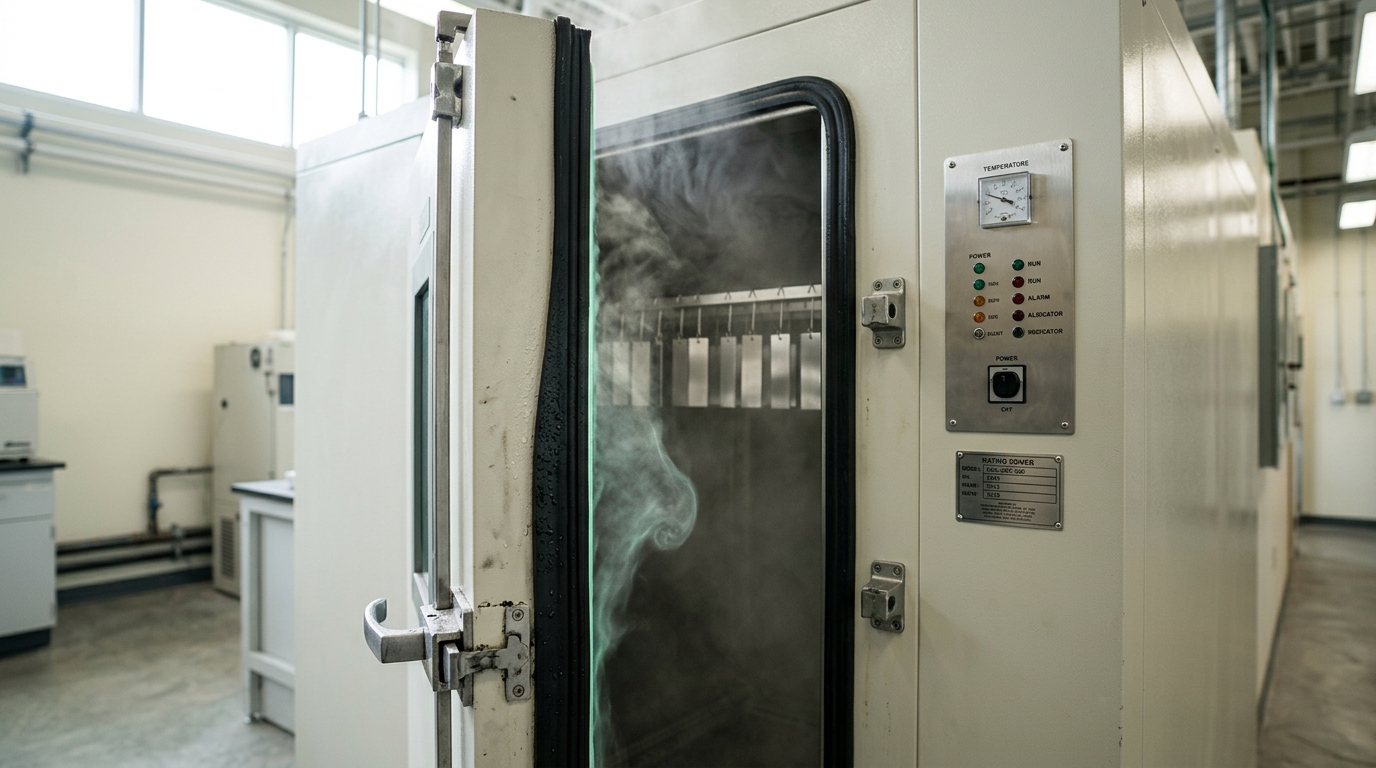
Figure 2. Accelerated aging compresses years of exposure into weeks by raising temperature, humidity, or salt load — and every one of those knobs can also switch on a mechanism the field never encounters. — Image prompt and art direction by Brecht Corbeel; generation pending.
The mechanistic reason accelerated tests can mislead is that raising the stress variable does not always leave the failure mechanism unchanged. Frankel’s review of pitting corrosion lays out how localized breakdown of a passive oxide film depends on a threshold potential, chloride concentration, and temperature in a coupled, nonlinear way — push chloride concentration or temperature far enough and the pitting mechanism itself, and the alloy ranking it produces, can shift relative to what occurs at realistic exposure levels [5]. The same caution applies to thermal aging of polymers: raising oven temperature to accelerate an Arrhenius-type degradation rate is valid only while the dominant chemical mechanism stays the same across the temperature range used. Where an elevated-temperature test crosses a transition — a glass transition, a change in oxidation pathway, a melting or crystallization event — the extrapolated acceleration factor no longer describes what happens at service temperature. A first-order approximation for a single, unchanged mechanism follows
AF = \exp\!\left[\frac{E_a}{k_B}\left(\frac{1}{T_{\mathrm{use}}} - \frac{1}{T_{\mathrm{test}}}\right)\right],
where E_a is the mechanism’s activation energy, T_{\mathrm{use}} and T_{\mathrm{test}} are absolute temperatures, and k_B is Boltzmann’s constant. This is a genuine, useful model — it is also only as good as the assumption that E_a and the mechanism are constant over the interval being extrapolated, an assumption every accelerated-aging program should state and test rather than take on faith. Semiconductor reliability qualification builds the same logic into a formal standard: JEDEC’s thermal-cycling method specifies temperature extremes, ramp rates, and cycle counts intended to induce solder-joint fatigue and package delamination on an accelerated schedule that correlates, within a validated range, to field thermal cycling [4]. The correlation is validated for the package types and use conditions the standard was built around; extending it to a novel package geometry or a harsher field environment without new correlation data repeats the same extrapolation risk.
Battery cycle-life testing: turning a chemical question into a statistics problem
Battery cycle life is not measured on one cell. Cell-to-cell manufacturing variation, combined with the fact that a cell can fail slowly (gradual capacity fade) or abruptly (a sudden voltage or impedance jump), means a defensible cycle-life claim requires many cells run in parallel on channels of a multichannel cycler, under protocols standardized well beyond a simple “charge and discharge repeatedly.” The U.S. Department of Energy’s Idaho National Laboratory battery test manual, developed for USABC electric-vehicle qualification, specifies baseline life-cycle tests, reference performance tests run periodically to track fade without disturbing the aging protocol, and accelerated-aging test variants that vary temperature and depth of discharge to separate calendar aging from cycling aging [2]. That separation matters: a cell can lose capacity while sitting idle on a shelf (calendar aging) as well as while being cycled, and a test protocol that conflates the two will misattribute fade to the wrong mechanism.
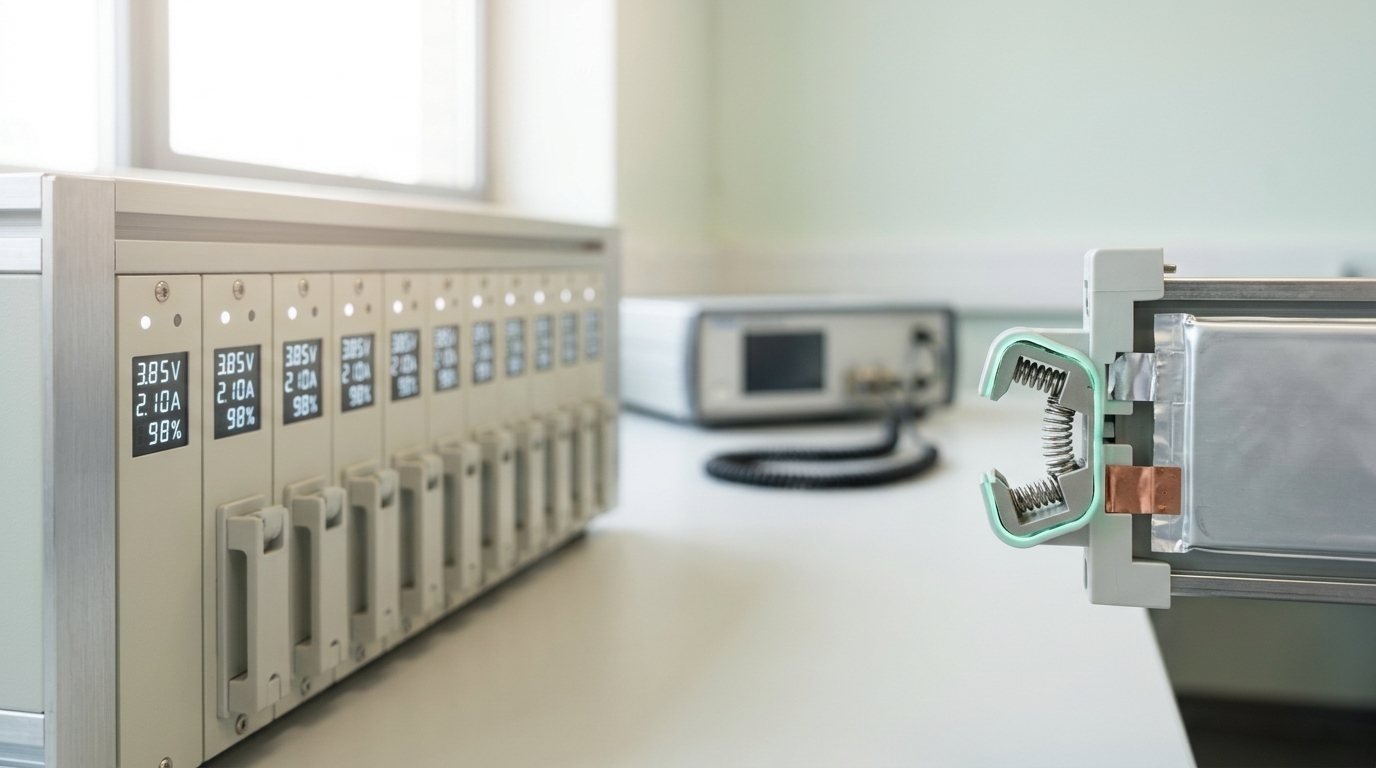
Figure 3. Cycle-life numbers come from hundreds of channel-years of testing, not from a single cell run once — and most of that time is waiting. — Image prompt and art direction by Brecht Corbeel; generation pending.
Vetter and coauthors’ widely cited review of lithium-ion aging mechanisms catalogs why cells fade: solid-electrolyte-interphase growth on the anode consumes cyclable lithium and increases impedance; lithium plating at low temperature or high charge rate can occur when the anode’s insertion kinetics cannot keep pace with the applied current, creating a safety hazard distinct from ordinary capacity fade; cathode particle cracking and transition-metal dissolution degrade the cathode independently of anode-side mechanisms [1]. A single capacity-versus-cycle-number curve cannot distinguish these mechanisms from each other; that requires complementary measurements — incremental capacity analysis, electrochemical impedance spectroscopy, and, at end of test, post-mortem structural characterization of the same XRD and TEM kind described above, now applied to a harvested electrode rather than a pristine one. A coarse but common summary statistic is coulombic efficiency, the ratio of discharge to charge capacity within one cycle,
\mathrm{CE} = \frac{Q_{\mathrm{discharge}}}{Q_{\mathrm{charge}}},
whose slow, sustained departure from unity across cycling is itself diagnostic of a parasitic side reaction consuming charge without returning usable capacity — a small departure per cycle, summed over a thousand cycles, is where most of the calendar-relevant fade actually accumulates, and is a more sensitive early warning than watching total discharge capacity alone.
The practical limit of accelerated cycle-life testing mirrors the corrosion case: raising temperature or charge rate to shorten a multi-year test to a manageable number of months risks activating a fade mechanism — lithium plating being the clearest example — that would not occur, or would occur far more slowly, at the intended service condition. A cycle-life number obtained at an aggressive test condition and extrapolated to a mild service condition without validating that the dominant fade mechanism is unchanged across that gap is exactly the same category of overclaim as an uncorrelated accelerated corrosion result.
Semiconductor and polymer reliability: the package is the test article, not the material alone
Reliability qualification for a semiconductor product tests the packaged part, not the bare die, because most field failures originate at interfaces — solder joints, wire bonds, die-attach layers — introduced by packaging rather than in the semiconductor material itself. JEDEC’s JESD22 test family specifies thermal cycling, temperature-humidity-bias stress, and mechanical stress tests intended to accelerate exactly these interface failure modes to a schedule manufacturers can complete before shipping [4]. A wafer-level electrical probe test, run before packaging, checks that a die functions — it says nothing about how the assembled package will hold up to years of thermal cycling in the field, and treating a probe pass as a reliability result is a category error that shows up periodically in early-stage component marketing.

Figure 4. Reliability qualification stresses a package, not just a die — and a probe test only checks that the part still answers, not why it will eventually stop. — Image prompt and art direction by Brecht Corbeel; generation pending.
Polymer components face an analogous package-versus-material distinction: a resin’s intrinsic thermal-oxidative stability, measured on a small coupon in an oven, does not by itself predict the life of a molded part that also experiences mechanical load, UV exposure, and contact with other materials that can catalyze or inhibit degradation locally. Accelerated weathering chambers combining UV exposure with condensation cycling attempt to approximate this combined stress, with the same caveat as salt-fog testing: they compress time by intensifying stress, and the correlation to a specific real-world climate has to be established for the specific material and application, not assumed from the chamber’s general reputation.
Autonomous laboratories: closing the loop, not replacing the bench
The newest development in materials characterization is not a new instrument but new orchestration: robotic systems that propose a composition or process, synthesize it, and characterize it without a human in the loop for each iteration. MacLeod and coauthors demonstrated a modular robotic platform that optimized thin-film optical and electronic properties by iterating synthesis and measurement under a model-based search algorithm, without human intervention between iterations [9]. Burger and coauthors built a mobile robot that moved between existing, unmodified laboratory instruments — rather than requiring bespoke integrated hardware — to explore a photocatalyst formulation space over an extended unattended run, screening far more of the space than a human team working the same instruments manually [8].

Figure 5. Autonomous labs close a loop between a proposed composition and a measured property, but the loop still has to survive an oven, a diffractometer, and a robot's own scheduling errors. — Image prompt and art direction by Brecht Corbeel; generation pending.
These systems still depend on the same characterization instruments discussed above, with the same caveats attached: an autonomous loop optimizing against an XRD-derived phase-purity metric inherits every limitation of powder XRD’s averaging over volume, and a loop scored against an accelerated degradation proxy inherits that proxy’s correlation risk to real service conditions. What autonomous synthesis changes is throughput and consistency of execution, not the epistemics of what any one measurement means. The Materials Project and similar computational databases play a complementary role upstream of physical synthesis: by pre-screening candidate compositions against calculated formation energies and structures at much lower cost than physical synthesis, they narrow the experimental search space autonomous or human-run labs then have to physically test [7]. A computed stability or property value from such a database is a prediction to be verified, not a substitute for the physical characterization chain described in this guide — treating a database entry as equivalent to a measured result is the computational-era version of treating a probe test as a reliability result.
Reading a materials claim: fact, overclaim, analysis, and what is still open
A defensible claim about a new material specifies which instrument produced which number, under which protocol, and states the known gap between that protocol and the service condition it is meant to predict. “This alloy passed 1,000 hours of ASTM B117” is a fact about one accelerated test. “This alloy will resist coastal corrosion for twenty years” is an inference that requires either field correlation data for that specific alloy family or an explicit, stated assumption that the pitting mechanism observed under test conditions is the same one that would operate in the field — an assumption Frankel’s mechanistic picture shows is not automatic [5]. “This cell achieved 2,000 cycles at 45°C and 1C” is a fact about one accelerated cycling protocol; “this cell will last fifteen years in a stationary storage application” is a claim that needs calendar-aging data at the actual storage temperature, not an extrapolation from an accelerated cycling number alone [1] [2]. Where a vendor, a preprint, or a conference slide collapses that distinction, the honest response is not to reject the underlying data but to ask which gap between test and service condition was actually closed, and which was merely assumed away.
Looking three to five years out, the more consequential open questions are less about any single instrument and more about integration: whether autonomous synthesis-and-characterization loops can be trusted to flag when their own scoring proxy has stopped correlating with the property that actually matters in service, the way a human specialist is trained to notice when an accelerated-aging result looks mechanistically suspicious. That is an observable, falsifiable question — it will show up as autonomous-discovery literature either reporting systematic post-hoc validation against slower, more realistic tests, or not — and a horizon of several years is reasonable because it depends on adoption of these platforms broadening past the handful of demonstration systems published so far [9] [8]. The disconfirming case would be autonomous platforms increasingly cited for field-validated, multi-year outcomes rather than accelerated-proxy optimization; that has not yet been demonstrated at scale, and the two published systems cited here focused on synthesis-and-measurement throughput rather than long-horizon service validation, which is exactly the gap this guide’s other sections describe.
Sources
- Jens Vetter, Peter Novák, Martin R. Wagner, Claudia Veit, Karl-Christian Möller, J.O. Besenhard, M. Winter, M. Wohlfahrt-Mehrens, C. Vogler, and A. Hammouche. Ageing mechanisms in lithium-ion batteries. Journal of Power Sources (2005). DOI: 10.1016/j.jpowsour.2005.01.006.
- Jon P. Christophersen (Idaho National Laboratory). Battery Test Manual For Electric Vehicles, Revision 3. U.S. Department of Energy / Idaho National Laboratory (2015).
- ASTM International. B117: Standard Practice for Operating Salt Spray (Fog) Apparatus. ASTM International (2019).
- JEDEC Solid State Technology Association. JESD22-A104: Thermal Cycling Test Method for Semiconductor Reliability. JEDEC (2021).
- G. S. Frankel. Pitting Corrosion of Metals: A Review of the Critical Factors. Journal of the Electrochemical Society (1998). DOI: 10.1149/1.1838615.
- B. H. Toby and R. B. Von Dreele. GSAS-II: the genesis of a modern open-source all purpose crystallography software package. Journal of Applied Crystallography (2013). DOI: 10.1107/S0021889813003531.
- Anubhav Jain, Shyue Ping Ong, Geoffroy Hautier, Wei Chen, William Davidson Richards, Stephen Dacek, Shreyas Cholia, Dan Gunter, David Skinner, Gerbrand Ceder, and Kristin A. Persson. Commentary: The Materials Project — a materials genome approach to accelerating materials innovation. APL Materials (2013). DOI: 10.1063/1.4812323.
- Benjamin Burger, Phillip M. Maffettone, Vladimir V. Gusev, Catherine M. Aitchison, Yang Bai, Xiaoyan Wang, Xiaobo Li, Ben M. Alston, Buyi Li, Rob Clowes, Nicola Rankin, Brandon Harris, Reiner Sebastian Sprick, and Andrew I. Cooper. A mobile robotic chemist. Nature (2020). DOI: 10.1038/s41586-020-2442-2.
- Benjamin P. MacLeod, Fraser G. L. Parlane, Thomas D. Morrissey, Florian Häse, Loïc M. Roch, Kevan E. Dettelbach, Raphaell Moreira, Lars P. E. Yunker, Michael B. Rooney, Joseph R. Deeth, Veronica Lai, Gordon J. Ng, Henry Situ, Ray H. Zhang, Michael S. Elliott, Ted H. Haley, David J. Dvorak, Alán Aspuru-Guzik, Jason E. Hein, and Curtis P. Berlinguette. Self-driving laboratory for accelerated discovery of thin-film materials. Science Advances (2020). DOI: 10.1126/sciadv.aaz8867.
Originally published at https://absolutedigitalpublishers.com/articles/materials-discovery-and-degradation-in-practice-an-advanced-technical-guide.