How Energy, Infrastructure, and Civilization Actually Work
EROI, grid balancing, and infrastructure inertia are the three mechanisms that decide which fuels a society can actually run on and how fast it can change its mind.

EROI is a ratio, not a preference: it is the energy a fuel source returns divided by the energy spent finding, extracting, and delivering it. — Image prompt and art direction by Brecht Corbeel; generation pending.
Abstract
A complex society does not run on energy in the abstract; it runs on the energy left over after the energy spent finding, extracting, and delivering that energy is subtracted. This briefing walks through three linked mechanisms: energy return on investment (EROI) as the ratio that actually determines whether a fuel source can support anything beyond fetching more of itself; the second-by-second and hour-by-hour control hierarchy a modern grid uses to keep supply and demand equal; and the physical, not political, reason energy transitions measure in decades. Fact, vendor claim, analysis, and prediction are kept separate throughout.
Civilization does not run on energy. It runs on the energy left over after the energy spent getting that energy is subtracted. That subtraction — energy return on investment, or EROI — is the first of three mechanisms this briefing walks through: what actually determines whether a fuel source can support more than its own extraction, how a modern electrical grid actually keeps supply matched to demand every second of every day, and what an “energy transition” actually requires in physical, not rhetorical, terms.
EROI: the ratio that does the real work
EROI is defined as the ratio of energy delivered to society by a fuel source to the energy invested in finding, extracting, refining, and delivering it [1]. A fuel with an EROI of 20 returns twenty units of usable energy for every one unit spent obtaining it; a fuel with an EROI of 3 returns three. That is the entire concept — no more, no less — and it is a fact about physical process, not a policy preference.
Reported EROI values vary by study and by how narrowly “energy invested” is drawn, but the range across recent literature clusters as follows: conventional oil roughly 18-43, nuclear power roughly 20-81, wind turbines averaging near 16-20 in operational studies, solar photovoltaics roughly 6-34 depending on harmonization method, and corn ethanol close to the bottom at around 1.4 [1] [2]. Coal and hydroelectric power are frequently reported among the highest-return sources, though exact figures diverge sharply between studies depending on whether externalities and grid-integration costs are counted [2].
Two things about that spread matter more than any single number. First, researchers Murphy and Hall have proposed threshold values rather than a single “good” number: an EROI of roughly 5 is argued as the minimum for a fuel to clear its own logistic overhead, while a value near 12-13 is argued as what a society needs to sustain not just subsistence but surplus activity — technological development, art, research, anything beyond feeding and moving itself [1]. That second threshold is analysis built on the ratio, not the ratio itself, and it depends on assumptions about how much surplus modern life actually requires — treat it as an argument, not a settled fact. Second, EROI is not the only thing that determines whether a fuel is used. Carbon Brief’s review is explicit that EROI omits environmental costs entirely and that a fuel’s real-world economics depend heavily on how it is integrated with everything else already on the grid, particularly for intermittent sources that need dispatchable backup to be useful at all [2]. A high EROI number is a necessary condition for a fuel supporting complex society; it is not sufficient by itself.
How a grid actually balances itself, second by second
A power grid has no meaningful storage of its own generation at scale — electricity produced that is not consumed an instant later has nowhere to go — so supply and demand have to be held equal continuously. The mechanism is a layered control hierarchy, not a single dial.
The controlling variable is frequency. In a grid running at its target frequency (60 Hz in North America), generation and load are in balance; if supply exceeds demand, frequency rises, and if demand exceeds supply, frequency falls [4]. Grid operators use that frequency reading as a real-time proxy for the imbalance itself, and correct it in three tiers operating on three different clocks. Primary control acts within seconds, an automatic governor response built into generating equipment that reacts to a frequency deviation the moment it appears, comparable to a car’s cruise control holding speed against a hill. Secondary control acts within minutes — operators actively redispatching output, opening or closing a hydroelectric gate, ramping a plant up or down in response to a signal. Tertiary control acts across hours, bringing additional generation online ahead of an anticipated peak, such as starting a natural-gas plant before an evening demand surge [4].
That three-tier structure is a fact about how balancing authorities and regional grid operators actually run the system today, verified for a real operating authority rather than assumed. It is worth separating from a claim voiced increasingly by grid operators and vendors: that batteries, smart-grid controls, and demand response will make this balancing problem easier as intermittent wind and solar generation grows [4]. That is a forward-looking vendor and industry assertion, not a demonstrated fact at the scale current grids are approaching — treat it as a claim under active testing, not a settled outcome.
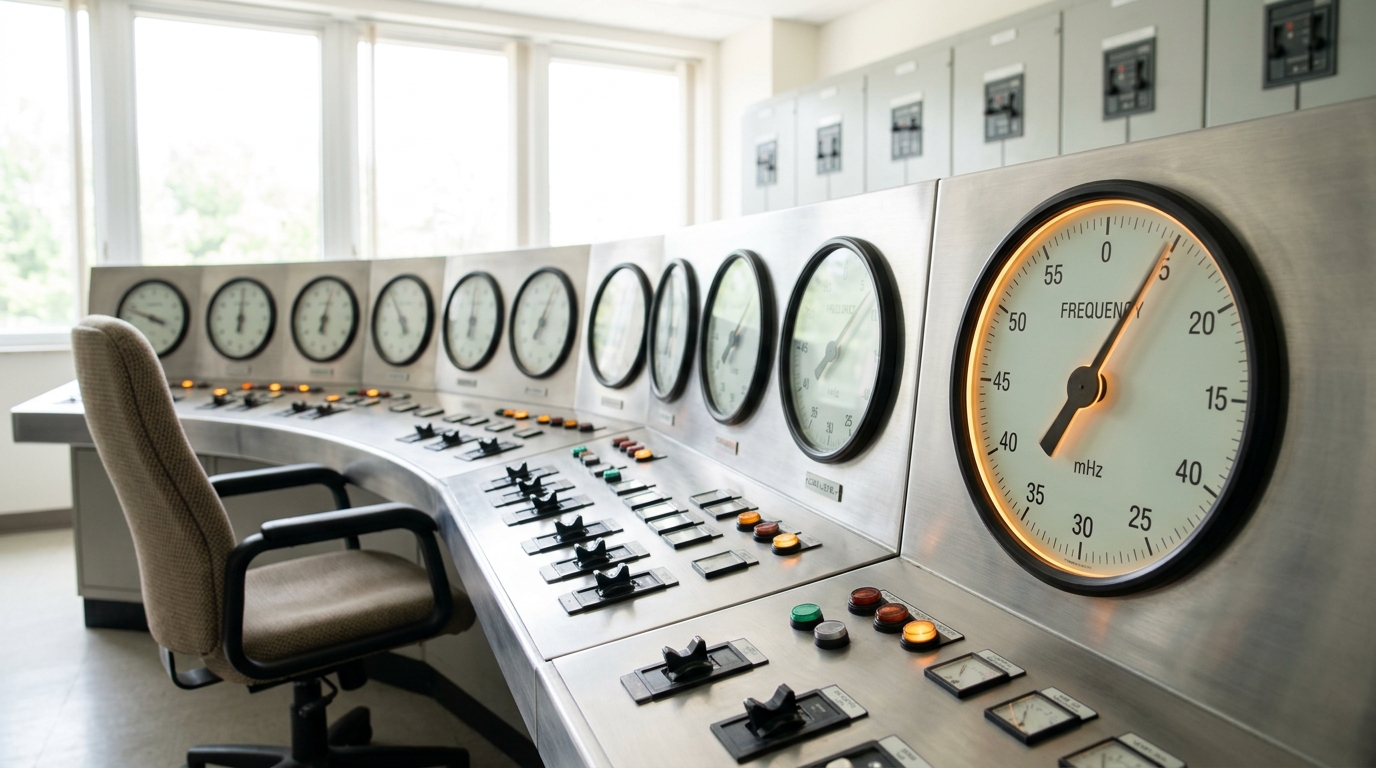
Figure 1. A grid balances supply and demand in layers: automatic response within seconds, dispatch adjustments within minutes, and scheduled generation brought on within hours. — Image prompt and art direction by Brecht Corbeel; generation pending.
Why an energy transition is a construction problem, not a switch
“Energy transition” is often discussed as though it were a decision a society could make and then have take effect. Historically it has never worked that way. Vaclav Smil’s analysis of past transitions found that once a fuel reached even 5 percent of global primary energy supply, it still took on the order of 35 to 55 years to climb from that foothold to a 25 percent share — 35 years for coal, roughly 40 for oil, and about 55 for natural gas [3]. That is a historical fact about the pace at which fuels that have already proven themselves technically and economically still took generations to scale.
The reason, per that same analysis, is not political willpower but physical inertia: the “existing massive and expensive energy infrastructures” — mines, pipelines, refineries, power plants, transmission networks, vehicle fleets, furnaces, and the capital tied up in all of them — cannot be replaced faster than the rate at which that capital can be written off, rebuilt, and re-financed [3]. Every plant retired early is a stranded asset; every replacement plant takes years to permit, finance, and build regardless of how quickly the underlying technology itself has matured. This is analysis grounded in observed historical rates, not a law of physics — a genuinely disruptive shift in construction financing, manufacturing scale, or policy could move faster than any prior transition ever has. But the base rate to disprove is 30-70 years per major fuel shift, not a decade, and the scale problem also compounds: global energy consumption today is many times larger than it was during the last two comparable transitions, meaning even a matched replacement rate takes longer in absolute terms simply because there is more to replace [3].
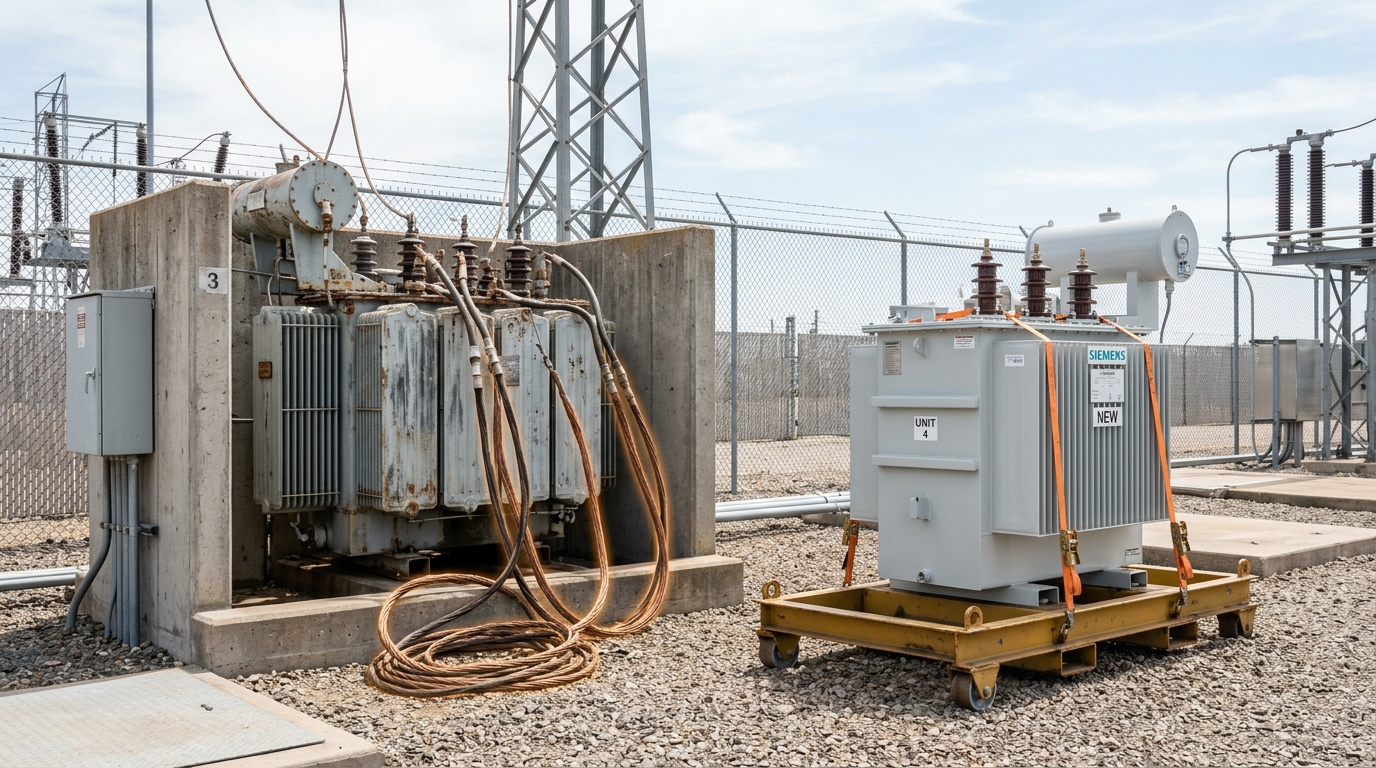
Figure 2. An energy transition is a physical replacement problem: every generator, transformer, pipeline, and furnace built for one fuel has to be swapped for one built for another, one at a time. — Image prompt and art direction by Brecht Corbeel; generation pending.
What follows, and what would falsify it
Put together, these three mechanisms suggest a specific, checkable claim rather than a general mood about energy: a national transition away from fossil generation should show measurable progress on EROI-weighted output per capita and on the fraction of transmission and generation infrastructure actually replaced, on a horizon of decades rather than a single political cycle. The scenario that would disconfirm this claim is a sustained, multi-year acceleration in physical infrastructure replacement rates — new transmission capacity, plant retirements, and vehicle-fleet turnover all running well above every historical precedent Smil’s data covers — sustained long enough to rule out a temporary construction boom. Short of that, the honest expectation, built from the ratio that decides which fuels can support a civilization and the historical rate at which societies have ever actually swapped one physical energy system for another, is that this transition runs on the same decades-long clock as the ones before it.
Sources
- Wikipedia contributors, synthesizing Hall, Murphy, and others. Energy return on investment. Wikipedia (2026).
- Carbon Brief staff. Energy return on investment - which fuels win?. Carbon Brief (2014).
- Resilience.org staff, reviewing Vaclav Smil. Book review: Energy Transitions: History, Requirements, Prospects. Resilience.org (2010).
- Atlantica Centre for Energy staff. Balancing the Grid 101. Atlantica Centre for Energy (2023).
Originally published at https://absolutedigitalpublishers.com/articles/how-energy-infrastructure-and-civilization-actually-works.