How AI Datacenter Power and Cooling Actually Work
A gigawatt-class AI campus is gated less by chips than by an interconnection queue, a transformer lead time, and a coolant loop — here is the physical chain, standard by standard.
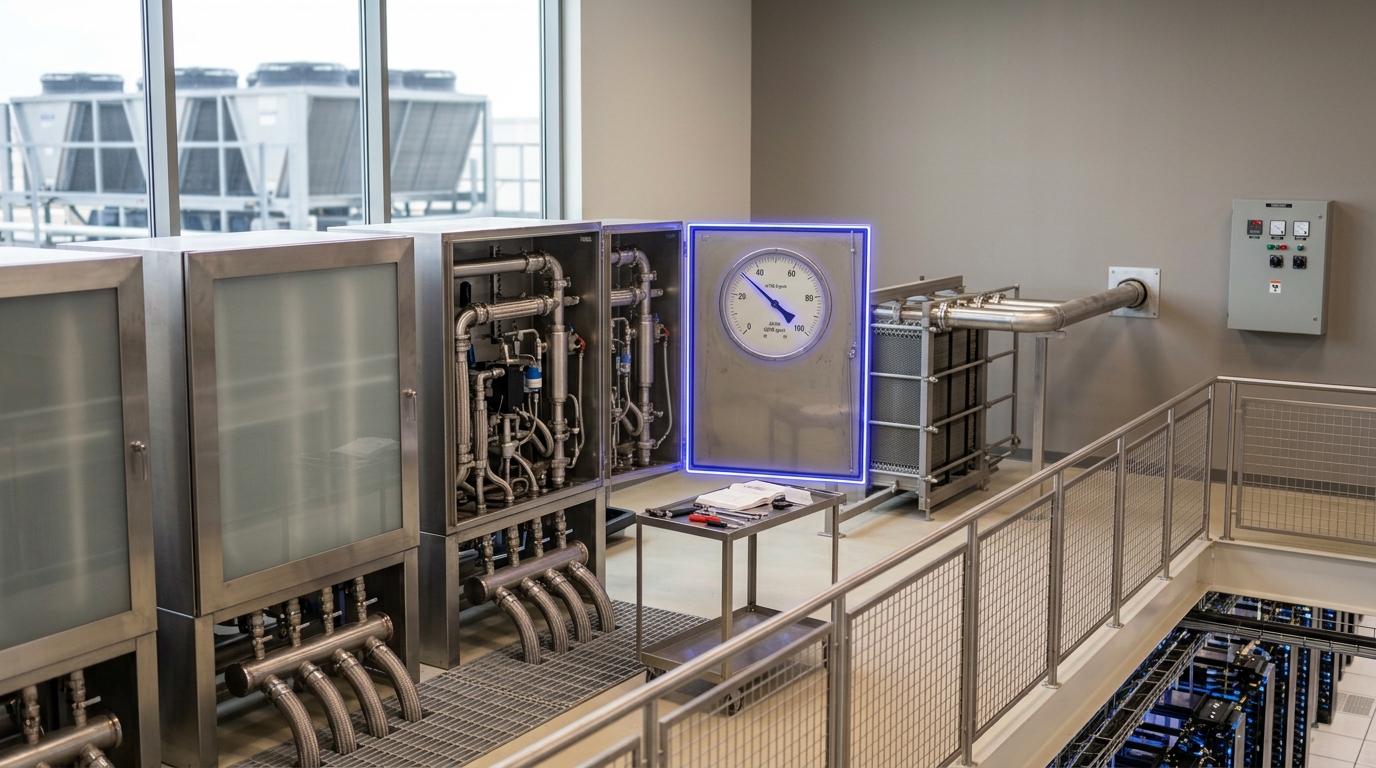
The central utility plant floor: where grid power, coolant loops, and heat-reuse piping physically meet. — Image prompt and art direction by Brecht Corbeel; generation pending.
Abstract
An AI datacenter's true bottleneck is rarely the rack. This article traces the physical and regulatory chain that actually gates a new AI campus: how a grid interconnection study and queue position determine when power is available at all, how power quality and on-site generation fill the gap before the grid connection lands, how ASHRAE's thermal classes and the H1 liquid-cooling guideline set the numbers that direct-to-chip and immersion systems must hit, how heat-reuse and water accounting change the economics of the cooling loop, and how load flexibility is emerging as a bargaining chip between operators and grid operators. Fact, vendor claim, analysis, and scenario are kept separate throughout, and every figure is tied to a named, dated, checkable source.
A new AI datacenter campus is usually described, in press releases, as a chip order: so many thousand accelerators, arriving on a schedule. That description is not wrong so much as it is describing the easiest part. The part that actually determines when the campus can turn on is a stack of physical and regulatory constraints that has nothing to do with semiconductors: a grid interconnection study, a transformer with a multi-year lead time, a coolant loop sized against a thermal standard, a water permit, and — increasingly — a negotiated agreement about when the campus is allowed to pull its full nameplate power at all. This article walks that stack in order, separating what is measured and standardized from what is a vendor claim, an analytical inference, or a forward-looking scenario.
The grid interconnection queue is the real front door
Before a datacenter can draw power, the generation or transmission capacity to serve it has to exist and be studied. In the United States, new generators and, increasingly, large new loads enter a queue and undergo an interconnection study — a modeled assessment of whether the surrounding grid can absorb the new power flow without violating thermal, voltage, or stability limits, and what network upgrades would be required if it cannot. Lawrence Berkeley National Laboratory’s Queued Up series tracks this queue nationally. As of the end of 2024, roughly 10,300 projects were active in U.S. interconnection queues, representing about 1,400 GW of generation capacity and close to 890 GW of storage — a queue larger than the country’s entire existing generating fleet [3]. The year before, at the end of 2023, the queue stood at about 2.6 TW of proposed capacity, up 27% year over year [3]. Fact, not inference: these are LBNL’s tabulations of utility and grid-operator queue data, not a market forecast.
The consequence for a datacenter developer is blunt: study timelines of two to four years are routine, and a study can come back requiring the developer to fund transmission upgrades that take longer still — a new substation, upgraded lines, sometimes years of transformer lead time, since large power transformers are themselves a constrained, mostly custom-built product with order books stretching out. This is why hyperscale operators increasingly pursue co-location — building the datacenter adjacent to an existing generator (often nuclear or gas) and drawing power behind the meter rather than waiting for a full transmission interconnection. That path collided directly with regulatory process in 2024–2025: the Federal Energy Regulatory Commission initially rejected a proposed co-location arrangement tied to an existing nuclear plant in Pennsylvania, citing insufficient justification and the risk of shifting transmission costs onto other ratepayers, and by December 2025 FERC had instead ordered PJM Interconnection — the grid operator covering the mid-Atlantic — to build explicit tariff rules for co-located loads, including new firm and non-firm transmission service categories with defined curtailment priority [4]. Fact: this rulemaking is a live regulatory process with 2026 compliance filing deadlines, not a settled framework — the rules a developer designs around today may not be the rules PJM actually files.
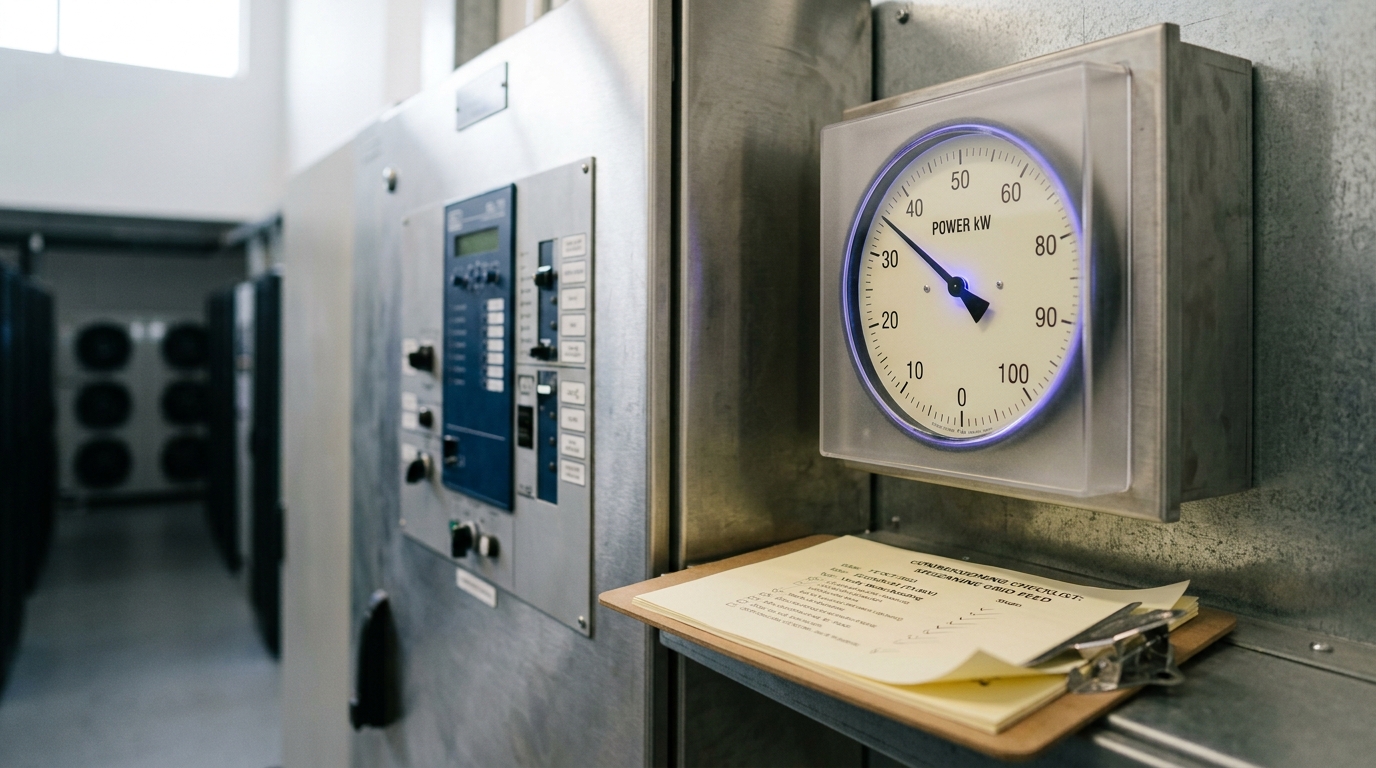
Figure 1. The interconnection point: where a years-long grid queue becomes an actual amp reading. — Image prompt and art direction by Brecht Corbeel; generation pending.
Power quality: the grid doesn’t hand you clean power
A granted interconnection is not the same as usable power. AI training and inference racks are unusual electrical loads: they can swing from near-idle to full draw in well under a second when a large training job checkpoints or a batch of inference requests lands simultaneously, producing load steps that ripple back into the grid as voltage sag or harmonic distortion if unmanaged. Uninterruptible power supplies, harmonic filters, and increasingly software-level power capping are the tools that keep this load-following behavior from becoming a grid power-quality problem, and they are also the buffer that covers the seconds-to-minutes gap before on-site backup generation (diesel or gas gensets, or increasingly batteries) can pick up load after a grid event. Analysis, not fact: the industry generally treats this rapid-swing behavior as a genuinely new grid challenge distinct from legacy datacenter load, but there is no single standardized public metric yet for how much AI-specific load volatility a given grid interconnection can tolerate before requiring active mitigation — this is judged case by case in interconnection studies rather than against a single published threshold.
A second, related power-quality concern sits upstream at the transmission level rather than inside the building: total harmonic distortion and reactive power drawn by large rectifier and power-supply banks can degrade the quality of power delivered to neighboring customers on the same feeder if uncorrected, which is one of the technical items an interconnection study is specifically checking for. Harmonic filters and power-factor correction equipment exist to keep a datacenter’s load profile close enough to a clean sinusoidal draw that it does not trip protection equipment elsewhere on the grid or draw a penalty rate from the utility for poor power factor. None of this is exotic electrical engineering — utilities have dealt with harmonic-heavy industrial loads (smelters, arc furnaces, large variable-frequency drives) for decades — but the scale and the synchronized, software-driven nature of AI load steps is a genuinely newer combination for grid operators to model, which is part of why interconnection studies for large AI loads increasingly take longer than studies for comparably sized but steadier industrial loads.
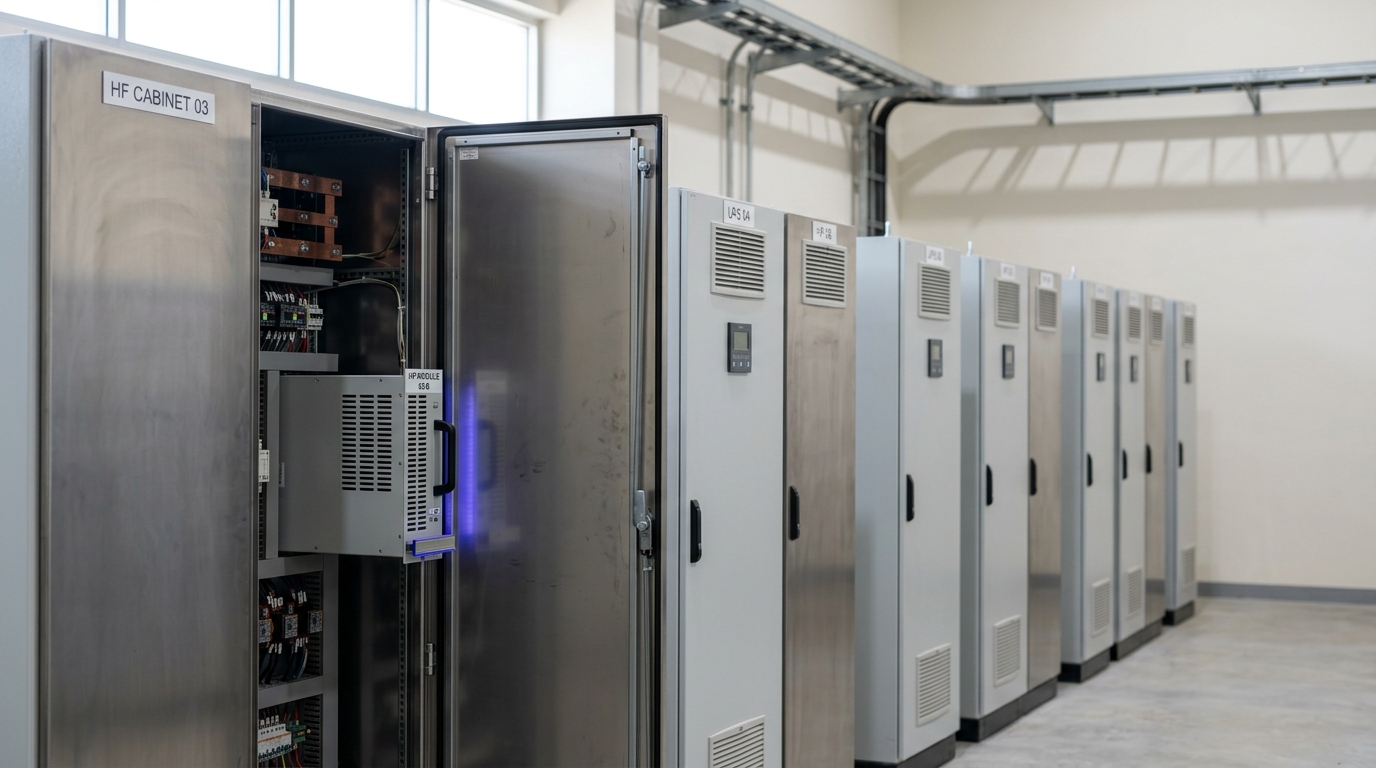
Figure 2. Power quality hardware absorbs what the grid cannot: transients, harmonics, and the gap before backup generation catches up. — Image prompt and art direction by Brecht Corbeel; generation pending.
What the ASHRAE thermal classes actually say
Once power reaches the rack, cooling has to remove essentially all of it as heat — in steady state, a datacenter is a device that converts electricity into heat with very high efficiency, and the cooling system’s entire job is transporting that heat somewhere else. ASHRAE Technical Committee 9.9 publishes the thermal envelopes that most of the industry designs against. Its Class A1 covers the tightest range — roughly 15–32°C air inlet — while A2 widens that to roughly 10–35°C, with a recommended inlet band of 18–27°C for reliability and efficiency across A-class equipment generally [5]. These are air-cooling classes. For the far higher power densities of modern AI accelerators, TC 9.9’s fifth edition introduced Class H1, a liquid-cooling classification built around a nominal coolant supply temperature of roughly 18–22°C delivered directly to the chip rather than to room air [5]. The distinction matters because it is not a marketing distinction: an accelerator rated for H1 coolant supply is validated against a specific inlet coolant temperature and flow rate, not against a room air temperature, and mixing the two mental models is a common source of miscommunication between facilities teams (who think in room air classes) and hardware teams (who think in coolant supply temperature).
The physical reason liquid cooling becomes necessary at all is straightforward: air has a volumetric heat capacity roughly one four-thousandth that of water, so once a rack’s heat density crosses roughly 20–30 kW, moving enough air through the rack to hold a safe temperature rise requires impractical airflow velocities and fan power. The heat-removal budget for a cold plate loop follows directly from the sensible-heat relation:
\dot{Q} = \dot{m}\, c_p\, \Delta T
where \dot{Q} is the heat to be removed (watts), \dot{m} is the coolant mass flow rate, c_p is its specific heat, and \Delta T is the temperature rise the coolant is allowed across the cold plate. This is the one relationship every cooling-loop sizing decision in this article reduces to: a facility either raises \dot{m} (bigger pumps, more flow, more pumping power) or accepts a larger \Delta T (which raises the return coolant temperature and can push a heat-reuse exchanger below its useful delivery temperature, discussed below). There is no way around the equation; every design choice downstream is a trade against these three terms.
Two liquid-cooling architectures dominate current deployment, and Uptime Institute’s 2024 Cooling Systems Survey gives the clearest public read on adoption: 22% of surveyed operators reported some use of direct liquid cooling in 2024, with a further 61% saying they would consider it but had not yet deployed it, and among current users, water cold-plate systems (direct-to-chip) were by far the most common technology, ahead of immersion [6]. Fact, with an important caveat the survey itself makes explicit: even among adopters, nearly half report DLC covering less than 10% of their racks — this is a technology in early, uneven rollout concentrated in high-performance computing and AI training fleets, not a completed industry transition [6].
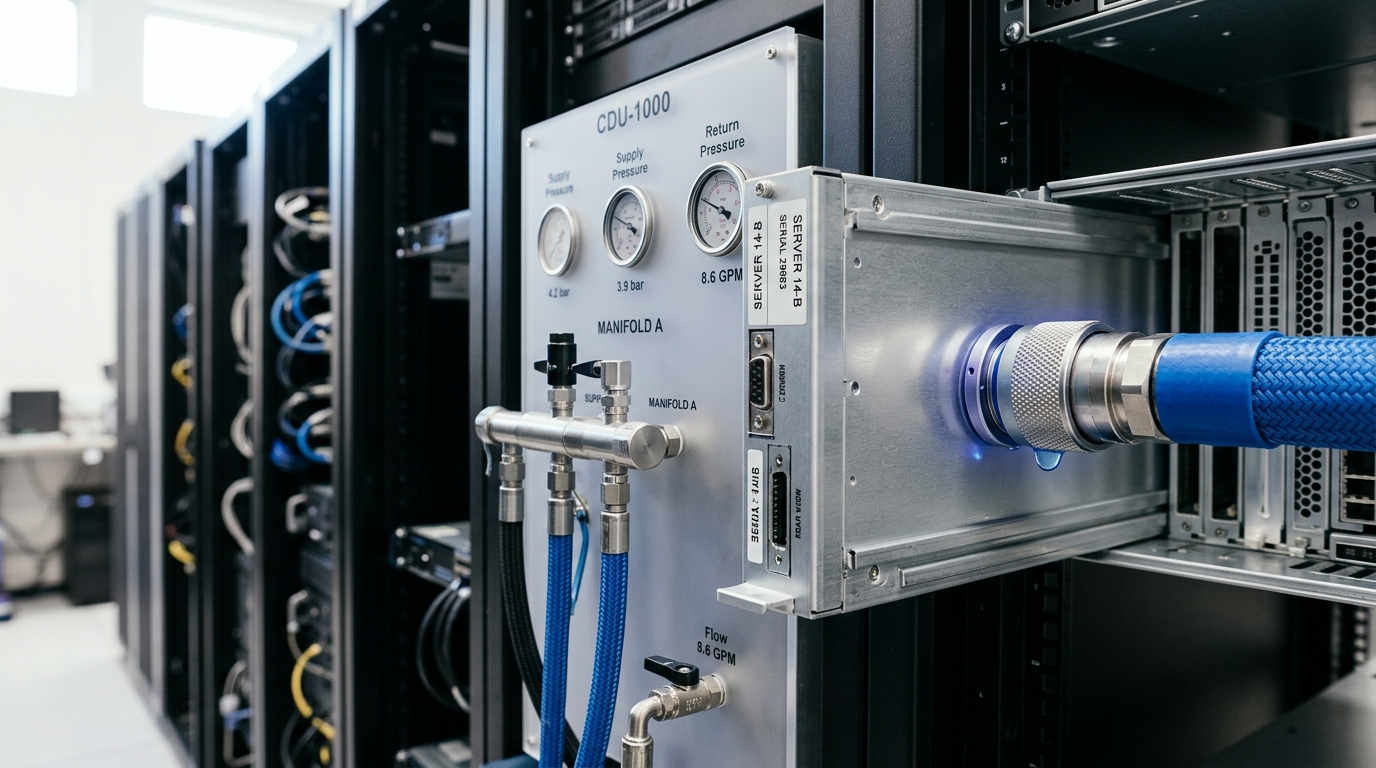
Figure 3. Direct-to-chip liquid cooling: a coolant distribution unit meters flow to a cold plate the instant the sled seats. — Image prompt and art direction by Brecht Corbeel; generation pending.
Direct-to-chip (cold-plate) cooling routes coolant through a metal plate bonded to the top of the processor package; a coolant distribution unit (CDU) sits between the facility water loop and the rack-level loop, isolating chemistry and pressure so a leak or contamination event on one side does not propagate to the other. Single-phase immersion cooling instead submerges an entire populated board in a dielectric fluid that does not conduct electricity, relying on natural or pumped convection through the fluid to carry heat to a heat exchanger at the tank’s edge. Immersion eliminates the cold plate’s thermal interface entirely — no component on the board runs hotter than the bulk fluid temperature plus whatever local rise the convection pattern allows — but it complicates routine hardware service, since a technician now handles wet boards, and it constrains which components (certain connectors, some optical modules) can be submerged at all.
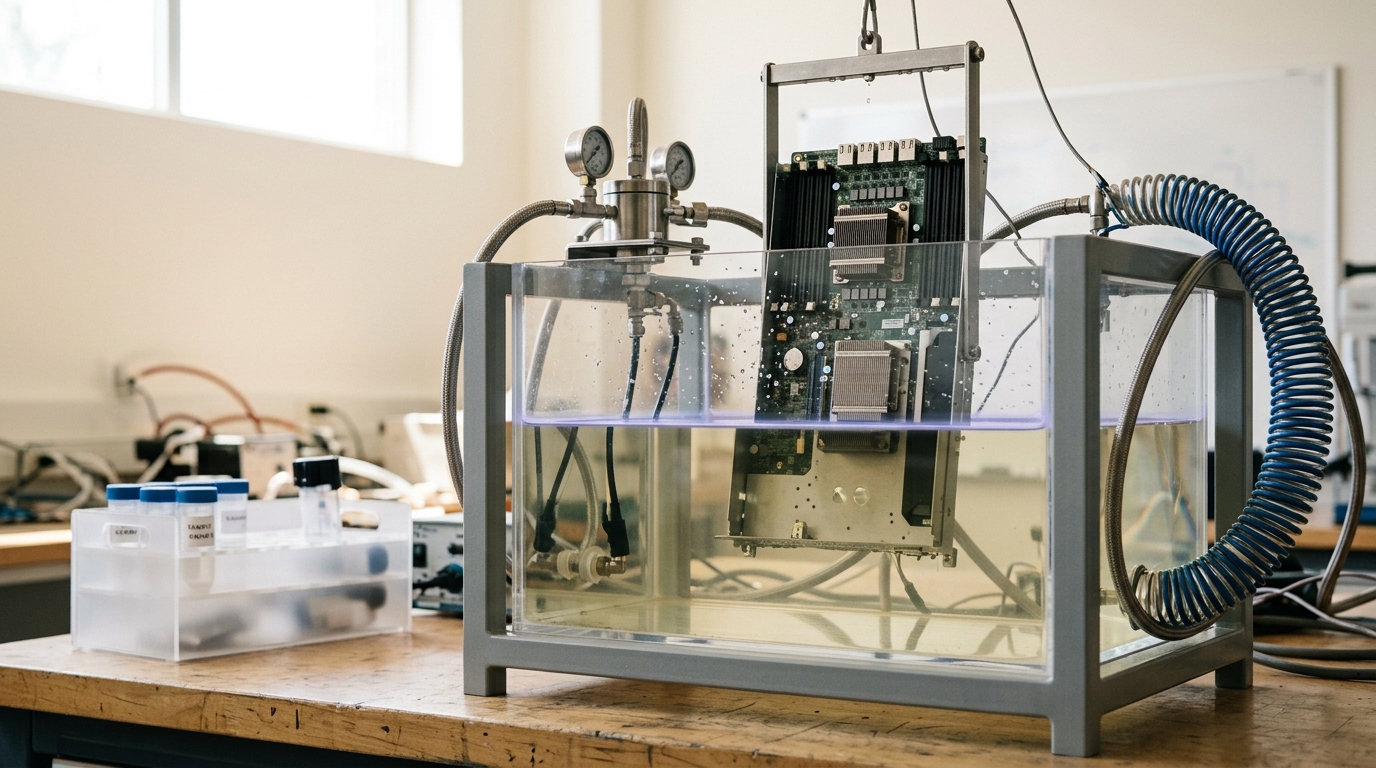
Figure 4. Single-phase immersion cooling: the whole board sits in dielectric fluid, and the fluid itself carries the heat away. — Image prompt and art direction by Brecht Corbeel; image generated to that direction.
Heat reuse: the coolant loop doesn’t have to be a dead end
A liquid-cooled datacenter’s coolant loop carries a large, continuous, low-grade heat stream — often in the 30–45°C range at the return side of a direct-to-chip loop — that is ordinarily rejected to outside air through dry coolers or cooling towers and simply wasted. Where a district heating network exists nearby, that stream can instead be lifted a further stage by heat pumps and injected into the network. The clearest public case is Microsoft and Fortum’s project in the Espoo, Kauniainen, and Kirkkonummi area of Finland, first announced in 2022 as what Microsoft described as the largest data-center waste-heat recycling scheme built to date [7]. By 2026 the physical plant was operating: two heat-pump stations comprising 40 air-to-water and 72 water-to-water heat pumps, delivering up to 180 MW of district heating capacity, backed by 200 MW of electric boiler capacity and 800 MWh of thermal storage for periods when datacenter heat alone is insufficient [8]. Fortum’s own figures project the recovered heat eventually supplying roughly 40% of district heating demand across the served area, serving on the order of 250,000 people, with an estimated 400,000 tonnes of annual carbon emissions avoided [7]. Vendor and utility assertion, not independently audited: those supply-share and avoided-emissions figures come from Microsoft’s and Fortum’s own announcements rather than from a third-party measurement program; they describe design intent and modeled outcomes, and this article treats them as claims to be checked against operating data as the system matures, not as settled facts.
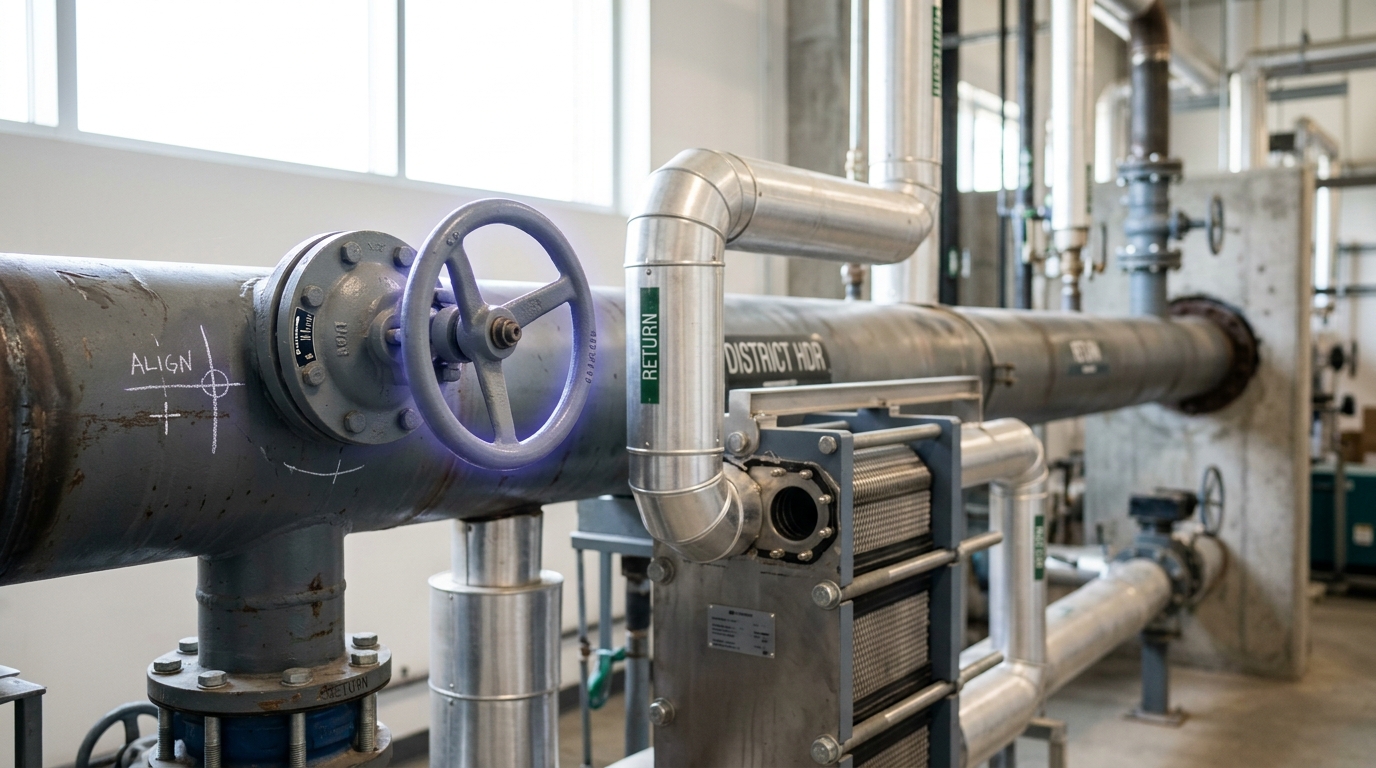
Figure 5. Heat reuse: a plate-and-frame exchanger lifts waste heat from the coolant loop into a district heating header. — Image prompt and art direction by Brecht Corbeel; generation pending.
Heat reuse imposes a real constraint back onto the cooling-loop design, and it is a direct consequence of the \dot{Q} = \dot{m} c_p \Delta T relation above: a district heating network needs delivery water above some useful temperature (often 60–90°C depending on the network), which is far above what a direct-to-chip loop returns on its own. A heat pump bridges that gap, but every heat pump has a coefficient of performance that degrades as the temperature lift it must perform increases — so a datacenter operator sizing for heat reuse has a genuine incentive to run its internal coolant loop at a higher return temperature than a pure cooling-efficiency design would choose, trading some cooling-loop pumping efficiency for a smaller, cheaper temperature lift on the heat-pump side. This is a real engineering trade-off with public precedent, not a hypothetical.
Water: the accounting problem cooling towers create
Where climate and site allow it, evaporative cooling towers reject heat far more cheaply than dry coolers, at the cost of consuming water through evaporation. The standard metric, Water Usage Effectiveness (WUE), is expressed in liters of water consumed per kilowatt-hour of IT energy delivered. Reported figures span a wide range: industry-average WUE for facilities using evaporative cooling clusters around 1.8–1.9 L/kWh, some well-run facilities in favorable climates report figures near 1.5 L/kWh, and best-in-class all-electric or dry-cooled designs can reach 0.3–0.7 L/kWh, while poorly sited evaporative facilities in hot, dry climates can consume substantially more [9]. Fact, with real spread: these numbers are climate-dependent and facility-specific; there is no single industry-wide WUE, and comparing two facilities’ WUE without controlling for climate and cooling architecture is not a valid comparison. The broader accounting problem is that water consumption is a local, often watershed-specific resource question — a datacenter with an unremarkable WUE number can still be a significant new draw on a stressed local aquifer or municipal supply, which is why water permitting has become a genuine siting constraint independent of the electricity interconnection process, and why some operators now report WUE alongside PUE (Power Usage Effectiveness) rather than treating power efficiency as the only efficiency metric that matters.
Carbon accounting: annual matching is not the same claim as hourly matching
A datacenter’s headline “100% renewable” claim conventionally rests on annual accounting: enough renewable energy is purchased or contracted over a year to match total annual consumption, even though the actual electrons drawn at 3 a.m. on a windless winter night are almost certainly from fossil generation. Google has pushed a stricter standard, 24/7 carbon-free energy matching, which scores each grid region on the fraction of hourly consumption actually matched by carbon-free generation on the same grid in the same hour, using metered data rather than annual contracts [10]. Analysis: hourly matching is a materially more demanding and more information-rich claim than annual matching, because it exposes exactly which hours a datacenter’s load is still fossil-backed, and it is these hours — typically evening peaks or periods of low wind — that matter most for local grid emissions. This is also precisely where load flexibility becomes relevant: an AI training job (as opposed to live inference serving) can often be paused, throttled, or time-shifted without violating a service commitment, and doing so during the hours when a grid region’s marginal generator is a fossil plant is one of the few carbon-accounting levers a datacenter operator actually controls at the facility level, as distinct from long-term power purchase agreements. Scenario, not fact — five-year horizon, testable by 2031: if FERC’s PJM co-location rulemaking and comparable proceedings in other regions succeed in creating clear, priced curtailment products for large flexible loads, expect training-heavy AI campuses to increasingly accept non-firm or interruptible transmission service in exchange for faster interconnection and lower connection costs, shifting a visible share of large training runs toward following grid conditions rather than running continuously. The disconfirming observation would be continued growth in firm-service interconnection requests for AI load with no measurable uptake of the new non-firm categories PJM is required to file by early 2026 [4].
The scale that makes all of this matter
None of these constraints are hypothetical at the margins of a niche industry. LBNL’s most recent national accounting put U.S. datacenter electricity use at roughly 176 TWh in 2023, about 4.4% of total U.S. electricity consumption, with a 2028 range of 325–580 TWh — meaning U.S. datacenter load could plausibly double or triple within five years of the report’s baseline [1]. The IEA’s global estimate for 2024 puts data-centre electricity consumption at roughly 415 TWh, about 1.5% of global electricity use, growing at around 12% a year since 2017 — more than four times the growth rate of total electricity demand — with a base-case projection of roughly 945 TWh by 2030, of which AI-specific workloads are expected to grow from a 5–15% share of datacenter power today to 35–50% by 2030 [2]. Fact, with an explicit scenario label on the AI-share figure: the historical consumption totals are measured; the 2028 and 2030 figures, including the AI workload share, are the source organizations’ own modeled projections, carrying the assumptions and uncertainty inherent in any multi-year energy forecast, and should not be read with the same confidence as the historical baseline.
What this means for anyone evaluating a datacenter power-and-cooling claim
Treat “we have power” as a queue position and a signed interconnection agreement, not a press release — ask for the study milestone and the in-service date. Treat a liquid-cooling claim as incomplete until it states whether the number is a room-air ASHRAE class or an H1 coolant supply temperature, since a vendor benchmark run under generous coolant conditions does not describe every site. Treat a heat-reuse or “100% renewable” claim as a design target with named assumptions until independently metered operating data is published, and check whether a carbon-free claim is annual or hourly-matched, since the two answer very different questions. And treat any WUE or PUE figure as meaningless without its climate and cooling architecture attached. The physical chain from grid queue to coolant loop to heat sink is long, mostly boring, heavily standardized where it counts, and almost never the part of the story that makes it into a chip-order headline — which is exactly why it is worth tracing directly.
Sources
- Lawrence Berkeley National Laboratory. 2024 United States Data Center Energy Usage Report. U.S. Department of Energy / LBNL (2024).
- International Energy Agency. Energy and AI: Energy demand from AI. IEA (2025).
- Lawrence Berkeley National Laboratory, Energy Markets & Policy Department. Queued Up: 2025 Edition, Characteristics of Power Plants Seeking Transmission Interconnection As of the End of 2024. LBNL (2025).
- Federal Energy Regulatory Commission. FACT SHEET: FERC Directs Nation's Largest Grid Operator to Create New Rules to Embrace Innovation and Protect Consumers. FERC (2025).
- Envigilance (compliance summary of ASHRAE TC 9.9 published guideline classes). ASHRAE TC 9.9: Data Center Thermal Guide. Envigilance (2026).
- Uptime Institute Intelligence. Uptime Institute Cooling Systems Survey 2024: Direct Liquid Cooling. Uptime Institute (2024).
- Microsoft News Centre Europe. Microsoft announces intent to build a new datacenter region in Finland, enabling large scale carbon-free district heating. Microsoft (2022).
- pv magazine editorial staff. Large-scale heat pumps utilize excess heat from Microsoft data centers in Finland. pv magazine Global (2026).
- Environmental and Energy Study Institute. Data Centers and Water Consumption. EESI (2025).
- RMI staff. Google Shows the Path to a Clean Energy Future. RMI (2024).
Originally published at https://absolutedigitalpublishers.com/articles/how-ai-datacenter-power-and-cooling-actually-works.