From Origins to Frontier: A History of Molecular Biology and Genomics
From a photograph of a fibre to a genome read cell by cell — how molecular biology built its instruments, and how each new instrument rewrote what a gene was taken to be.
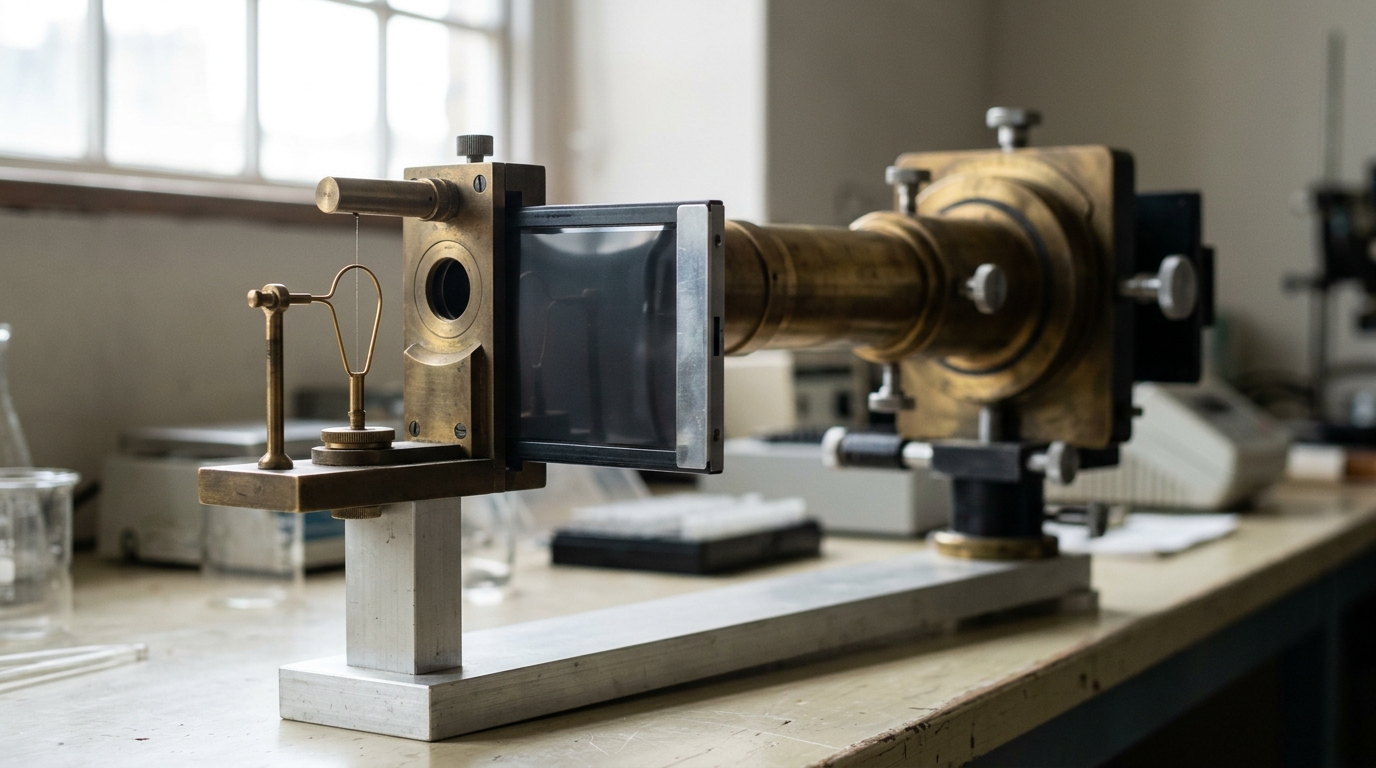
X-ray diffraction of DNA fibres supplied the measurements from which the double-helix model was built in 1953. — Image prompt and art direction by Brecht Corbeel; generation pending.
Abstract
This article traces molecular biology and genomics as a sequence of instruments and the conceptual revisions each one forced. It follows the 1953 double-helix model, the chain-termination sequencing method of the 1970s, the Human Genome Project's draft and finished assemblies, the discovery that most of the genome is transcribed and regulated rather than silent, the 2012 demonstration of CRISPR-Cas9 as a programmable editor, and the droplet-based single-cell methods that replaced the tissue average with a distribution of cell states. Throughout, it separates confirmed historical fact from contemporaneous overclaim, from present-day analysis, and from open questions about causal interpretation in genomics, and it treats gene regulation, genome variation, epigenetic marking, protein interaction networks, and single-cell measurement as one continuous argument about what counts as evidence for a causal claim in biology.
Every instrument in molecular biology’s history did two things at once: it produced a measurement, and it quietly redefined what a gene was taken to be. A photograph of a fibre gave the field a structure. A gel ladder gave it a sequence. A capillary array gave it a genome. A guide RNA gave it an edit. A droplet gave it a cell, one at a time, instead of an average across millions. None of these were merely faster versions of what came before; each one changed the unit the field could ask questions about. This is a history of those instruments, told with the dates, the papers, and the caveats that belong to each one — and a case for reading the field’s current frontier, single-cell causal genomics, as the latest turn of the same wheel rather than a break from it.
1953: a structure, not yet a mechanism
On 25 April 1953, Nature published a one-page letter by James Watson and Francis Crick proposing a double-helical structure for deoxyribonucleic acid, built from two strands held together by base pairing between adenine and thymine, and between guanine and cytosine [1]. The paper is famous for a sentence near its end — that the base-pairing scheme “immediately suggests a possible copying mechanism for the genetic material” — and that sentence is worth separating carefully from what the paper actually demonstrated.
What the 1953 letter established as fact: a specific, testable three-dimensional arrangement of the DNA molecule consistent with X-ray fibre-diffraction measurements and with the known ratios of the four bases. What it offered as a hypothesis rather than a demonstrated mechanism: that this structure explained heredity, replication, and mutation. The distinction matters historically, because it took another five years for the semiconservative replication the model implied to be confirmed experimentally, and considerably longer still to work out how the sequence of bases specified proteins. The 1953 paper is a structural result. Reading it as an instant, complete theory of the gene is the retrospective overclaim; reading it as the single best available account of DNA’s physical geometry, produced by fibre X-ray diffraction data, is the sourced fact.
That geometry was measured, not modeled from first principles. The X-ray diffraction patterns of stretched DNA fibres — the kind of apparatus the hero figure of this article depicts — supplied the layer-line spacings and helical repeat that constrained which structures were physically possible. Watson and Crick’s contribution was to find the specific pairing scheme consistent with those measurements and with Chargaff’s base-ratio rules. The structure did not, by itself, explain gene regulation, splicing, or the vast noncoding fraction of the genome that would occupy the field for the next seven decades; it explained how the molecule was put together and, by strong implication, how it could be copied.
1977: reading the sequence, one ladder at a time
A structure tells you the shape of the alphabet; it does not tell you what is written. That gap stood for roughly two decades until Frederick Sanger, Steven Nicklen, and Alan Coulson published a chain-termination sequencing method in the Proceedings of the National Academy of Sciences in 1977, using dideoxynucleotide analogues that halt DNA polymerase at a specific base and produce a ladder of fragments readable, lane by lane, as a sequence [2]. Sanger sequencing, alongside the contemporaneous Maxam-Gilbert chemical method, is the technology that converted molecular biology from a structural and biochemical discipline into a reading discipline: for the first time, the base-by-base content of a stretch of DNA could be determined directly rather than inferred.
The method’s core assumption is worth stating as a model, because it is the assumption every later sequencing technology has had to either preserve or explicitly break: that polymerase extension terminates at a predictable, base-specific position when a chain-terminating nucleotide analogue is incorporated, and that fragment length can be read as position along the template with single-base resolution on a denaturing gel. Later capillary electrophoresis systems replaced the slab gel with a bundle of glass capillaries and replaced radioactive labeling with four-color fluorescent tagging, but the terminate-and-measure-fragment-length logic is the same one Sanger’s 1977 paper established. This is why the gel-pour and capillary-loading figures in this article sit only one bench apart: they are the same idea, industrialized.
Sanger sequencing’s throughput, even automated, was measured in hundreds of bases per run per capillary. That ceiling is the reason the Human Genome Project took thirteen years and an international consortium to complete a single human genome, and it is the reason later short-read and long-read sequencing platforms — which this history treats as a separate, later story rather than folding in here — were built around abandoning gel electrophoresis entirely rather than further miniaturizing it.
2001 and 2004: a draft, then a finished sequence, and a surprise about gene count
The International Human Genome Sequencing Consortium published its draft sequence and initial analysis of the human genome in Nature in February 2001, reporting a coverage of roughly 90 percent of the euchromatic genome and, in the same paper, a preliminary count of protein-coding genes far lower than pre-genomic estimates had predicted — on the order of 30,000 to 40,000, not the 100,000-plus figure that had circulated through the 1990s [3]. Three years later, the same consortium published a “finished” sequence covering 99 percent of the euchromatic genome with a much lower error rate, and further reduced the gene-count estimate [4].
This is a good place to be explicit about the difference between fact, vendor-style overclaim, and analysis, because the Human Genome Project’s public reception blurred all three at the time. The fact: a coordinated, publicly funded, multi-institution sequencing effort produced and released a draft and then a finished assembly of the euchromatic human genome, with quality metrics reported in each paper. The overclaim, common in 2000-2001 press coverage rather than in the papers themselves: framing the sequence as a completed “book of life” that would directly yield disease mechanisms and cures on a short horizon. The analysis, which is closer to how working genomicists have described the result since: the sequence was a reference coordinate system and a parts list, not an explanation of function. The low gene-count surprise itself is a genuine, sourced finding, and it is also the first strong empirical sign that most of what the genome does could not be accounted for by protein-coding genes alone — a puzzle the field would spend the next decade chasing.
It’s worth noting that “finished” in the 2004 paper does not mean “complete” in the sense later achieved by telomere-to-telomere assemblies published in the 2020s using long-read technology; heterochromatic and repetitive regions were still unresolved in 2004. That later completion is a separate, subsequent milestone and is mentioned here only to bound the claim: the 2001 and 2004 papers are about the euchromatic genome, not the entire chromosome from end to end.
2012: the genome is mostly not silent — and the argument about what that means
In September 2012, the ENCODE Project Consortium published a coordinated set of analyses in Nature reporting that a large majority of the genome shows biochemical evidence of function — transcription, transcription-factor binding, or characteristic chromatin marks — assigning “biochemical function” to roughly 80 percent of the genome [5]. This is one of the more contested claims in the field’s recent history, and separating the parts is more useful than picking a side.
The fact, precisely stated: ENCODE’s assays detected biochemical activity — RNA polymerase occupancy, transcription-factor binding, DNase hypersensitivity, or specific histone modifications — over roughly 80 percent of genomic sequence in the cell types and conditions the consortium sampled. The overclaim, which the consortium’s own press materials leaned toward and which many news outlets reproduced without qualification, was to equate “shows biochemical activity somewhere, in some cell type” with “is functional” in the evolutionary or phenotypic sense — that is, that 80 percent of the genome does something the organism needs. Critics from evolutionary genomics pointed out, reasonably, that biochemical activity is a much weaker and much more permissive criterion than evidence of selective constraint, and that a large fraction of transcription may be low-level noise from an genome with many weak, unconstrained promoters rather than functional output. Where experts disagree here, the honest framing is not to declare a winner but to note that “80 percent biochemically active” and “80 percent evolutionarily functional” are different claims, only the first of which ENCODE’s data directly supports, and that this exact gap has structured a decade of subsequent argument about how to define a functional genomic element at all.
What is not in dispute, and is the analytically important legacy of the ENCODE era regardless of how the function debate resolves: gene regulation is not a small set of exceptions layered on top of a mostly inert genome. Enhancers, many of them far from the genes they act on and looping through three-dimensional chromatin contacts to reach them, transcription factors binding combinatorially rather than one gene at a time, and long noncoding RNAs with regulatory roles are now treated as the ordinary business of the genome rather than as curiosities. Epigenetic marking — DNA methylation and the pattern of histone modifications ENCODE catalogued at scale — is part of the same regulatory layer: it does not change the DNA sequence, but it changes which parts of that sequence are read, in which cell type, at which stage. This is why a genome sequence alone, however finished, was never going to be the whole explanation the 2001 draft was popularly expected to be; the sequence is a static parts list, and function is a dynamic, cell-type-specific, and often combinatorial property layered on top of it.
2012: a bacterial immune system becomes a programmable editor
In June 2012, Martin Jinek, Krzysztof Chylinski, Ines Fonfara, Michael Hauer, Jennifer Doudna, and Emmanuelle Charpentier published a paper in Science demonstrating that the Cas9 protein, guided by a single synthetic RNA combining the natural crRNA and tracrRNA components of a bacterial CRISPR immune system, could be programmed to cut double-stranded DNA at a site specified simply by changing that guide RNA’s sequence [6]. The Nobel Prize in Chemistry for 2020 was awarded jointly to Charpentier and Doudna “for the development of a method for genome editing,” with the Royal Swedish Academy of Sciences’ press release explicitly naming this re-programmability — the ability to direct a cut to a chosen site by changing the guide RNA rather than the protein — as the discovery being honored [7].
The fact: the 2012 paper showed programmable, sequence-specific double-strand cleavage of DNA in vitro using a simplified single-guide RNA and purified Cas9 protein. It is worth being precise that the 2012 Science paper’s central demonstration was biochemical — cleavage of target DNA in a test tube — and that the demonstration of Cas9-guided editing working inside living human and mouse cells followed in early 2013, from multiple groups. The vendor-style overclaim, which surrounded CRISPR reporting through the 2010s and still recurs in some current commercial and press coverage, treats the technology as a generic, error-free, universally applicable genome editor ready for routine human therapeutic use. The more careful analysis: CRISPR-Cas9 editing efficiency and specificity depend heavily on the target locus, the delivery method, and the cell type; off-target cleavage, incomplete editing, and unintended large structural changes at the cut site have all been documented in the years since 2012 and are active engineering problems, not solved ones. The therapeutic applications that have reached approval — treatments for sickle cell disease and beta-thalassemia among the first — are real and are a legitimate part of this history, but they represent specific, extensively optimized, ex vivo applications rather than evidence that in vivo editing of arbitrary targets in arbitrary tissues is a mature clinical tool.
It is also worth stating what CRISPR-Cas9 is not, historically: it is not the first gene-editing technology. Zinc-finger nucleases and TALENs preceded it and remain in use for some applications; CRISPR-Cas9’s advantage was not that cutting DNA at a chosen site became possible for the first time in 2012, but that re-targeting the cut became a matter of synthesizing a new twenty-base guide sequence rather than re-engineering a protein, which collapsed the cost and turnaround time of making a new editor from months to days.
The frontier: from a tissue average to a distribution of cells
The instruments discussed so far all shared one property regardless of era: they measured a population average. A slab gel, a capillary run, a genome assembly, even a bulk ENCODE chromatin assay, all describe a bulk sample — a tube containing DNA or RNA pooled from many thousands or millions of cells. The frontier this article treats as current is the move away from that average, toward measuring one cell at a time, at scale.
Evan Macosko, Anindita Basu, Rahul Satija and colleagues published Drop-seq in Cell in 2015, describing a microfluidic method that encapsulates individual cells together with uniquely barcoded beads in nanoliter droplets, so that RNA sequencing reads carrying the same barcode can later be computationally traced back to a single originating cell, at a throughput of thousands of cells per run [8]. This and contemporaneous droplet-based methods are the direct ancestor of the single-cell atlases — of tumors, developing embryos, and whole organs — that are now standard tools in genomics.
The methodological shift here is genuinely significant and deserves to be stated as a fact rather than folded into hype: a tissue-level average necessarily hides cell-to-cell heterogeneity, and many biological questions — which rare cell type drives a disease process, whether a drug response differs across cell subpopulations, how a population of stem cells diversifies during development — are not answerable from bulk data even in principle, because the average is compatible with many different underlying distributions of cell states. Droplet-based single-cell RNA sequencing made the distribution itself the measured object.
What deserves separate, careful treatment is the interpretive step from a single-cell measurement to a causal claim. Single-cell RNA sequencing is observational: it reports which genes are transcribed in a cell at the moment it was captured, not why. A cluster of cells sharing a transcriptional profile is a correlational grouping, and inferring that a particular transcription factor causes that state — rather than merely marking it — requires a separate causal intervention: a knockout, a CRISPR-based perturbation screen, or a controlled experimental manipulation whose effect is then read out, increasingly by pairing CRISPR perturbation with single-cell sequencing in the same experiment (methods generally described as Perturb-seq and its relatives). This is the same distinction that runs through the whole history recounted here, applied at a new scale: a measurement technology tells you what pattern exists; establishing what causes that pattern is a separate experimental and inferential problem, and conflating the two — treating an association found in a single-cell atlas as if it were already a demonstrated mechanism — is the same category of overclaim that surrounded the genome sequence in 2001 and the CRISPR biochemistry paper in 2012.
Reading a genomic result: what the field’s own standards require
The clinical wing of genomics has, over the same period, developed its own explicit rules for exactly this evidence problem, and they are a useful lens for the whole field. The American College of Medical Genetics and Genomics and the Association for Molecular Pathology published joint standards in 2015 for classifying a DNA sequence variant found in a patient as pathogenic, likely pathogenic, of uncertain significance, likely benign, or benign, based on a structured, weighted combination of evidence types — population frequency, computational predictions, functional studies, segregation with disease in families, and de novo occurrence, among others [9]. The framework’s most important feature, for the purposes of this history, is its default: a variant is classified as being of uncertain significance unless enough independent evidence accumulates to move it in either direction. Uncertainty is the default state a variant is assigned, not an embarrassing gap to be talked around.
That default is worth generalizing beyond the clinic. Genome variation — the roughly three to four million single-nucleotide differences that distinguish any two unrelated human genomes, alongside structural variants, copy-number changes, and repeat-length polymorphisms — is not, by itself, evidence of consequence. Most variants observed in a genome sequence have no established functional effect and, under a framework like the ACMG/AMP standards, would properly sit in the uncertain-significance category rather than being narrated as meaningful because they were found near an interesting gene. The same discipline that clinical variant classification imposes formally is the discipline the rest of genomics — regulatory annotation, single-cell cluster interpretation, protein-interaction network inference — owes itself informally: an association is a starting point for a causal claim, not a substitute for one.
A scenario, stated as a scenario
One live prediction in the field, and one worth stating with an explicit horizon and disconfirmation condition rather than as settled fact: over the next decade, routine clinical genomics is expected by many practitioners to shift from single-gene and single-variant interpretation toward integrated models combining a patient’s full variant set, single-cell expression data from relevant tissue, and protein-interaction network context, in order to resolve variants currently stuck in the uncertain-significance category. The assumption behind this prediction is that most of the genome’s causal architecture is combinatorial — many variants of small individual effect acting through shared regulatory and protein-network pathways — rather than concentrated in a small number of high-effect single genes outside of rare Mendelian disease. The observable indicator to watch for is a measurable, multi-year decline in the proportion of clinically reported variants classified as “uncertain significance” under ACMG/AMP-style criteria, driven by new functional and single-cell evidence categories rather than by loosened thresholds. The disconfirmation condition is equally specific: if that proportion does not fall, or falls only because classification thresholds were relaxed rather than because new independent evidence types were incorporated, the scenario should be treated as not realized, whatever narrative claims are made about it in the interim.
What the sequence of instruments actually shows
Read end to end, this history is not a story of one big idea unfolding — it is a story of a fixed question, “what does this stretch of DNA do and why,” being attacked by a series of instruments that each answered a narrower version of it and each, in doing so, revealed how much narrower that version had been. The 1953 structure explained geometry, not mechanism. The 1977 sequencing method explained content, not function. The 2001 and 2004 genome assemblies supplied a coordinate system, not an explanation. The 2012 ENCODE survey supplied biochemical activity, not proven evolutionary function, and the 2012 CRISPR biochemistry paper supplied a programmable cut, not a mature therapeutic platform. The droplet-based single-cell methods supply a distribution of states, not a demonstrated cause. Each instrument was real and each result was, on its own narrow terms, solid; the recurring error, across seven decades and multiple independent scientific communities, was to read the narrow result as the broad answer the field actually wanted. The corrective is not a new instrument — it is the older discipline the ACMG/AMP standards made explicit and formal: hold the classification as uncertain until the evidence, not the announcement, moves it.
Molecular biology’s next instruments will very likely be evaluated by the same standard this history applies retroactively to the ones already built: not whether they produce a striking image or a large number, but whether the causal claim built on top of that number was actually earned.
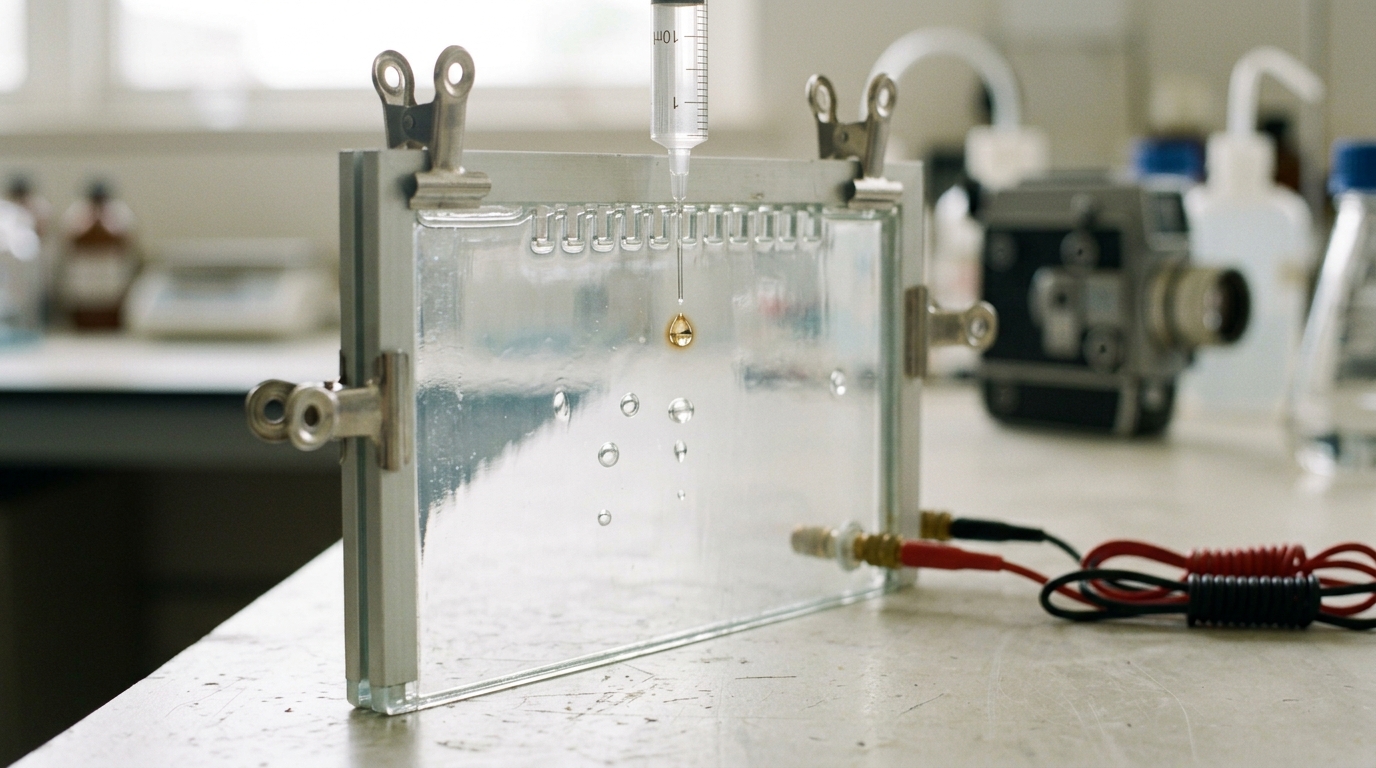
Figure 1. Sanger's chain-termination method turned sequencing into a readable ladder on a slab gel, run four lanes at a time [@sanger-1977]. — Image prompt and art direction by Brecht Corbeel; generation pending.
The methodological throughline — measurement first, causal interpretation held separately and provisionally — is what makes it possible to place the 1953 structure, the 1977 ladder, the 2001 draft, the 2012 biochemistry, and the droplet-based cell atlas on one continuous timeline rather than treating each as a discontinuous “revolution” needing its own vocabulary.
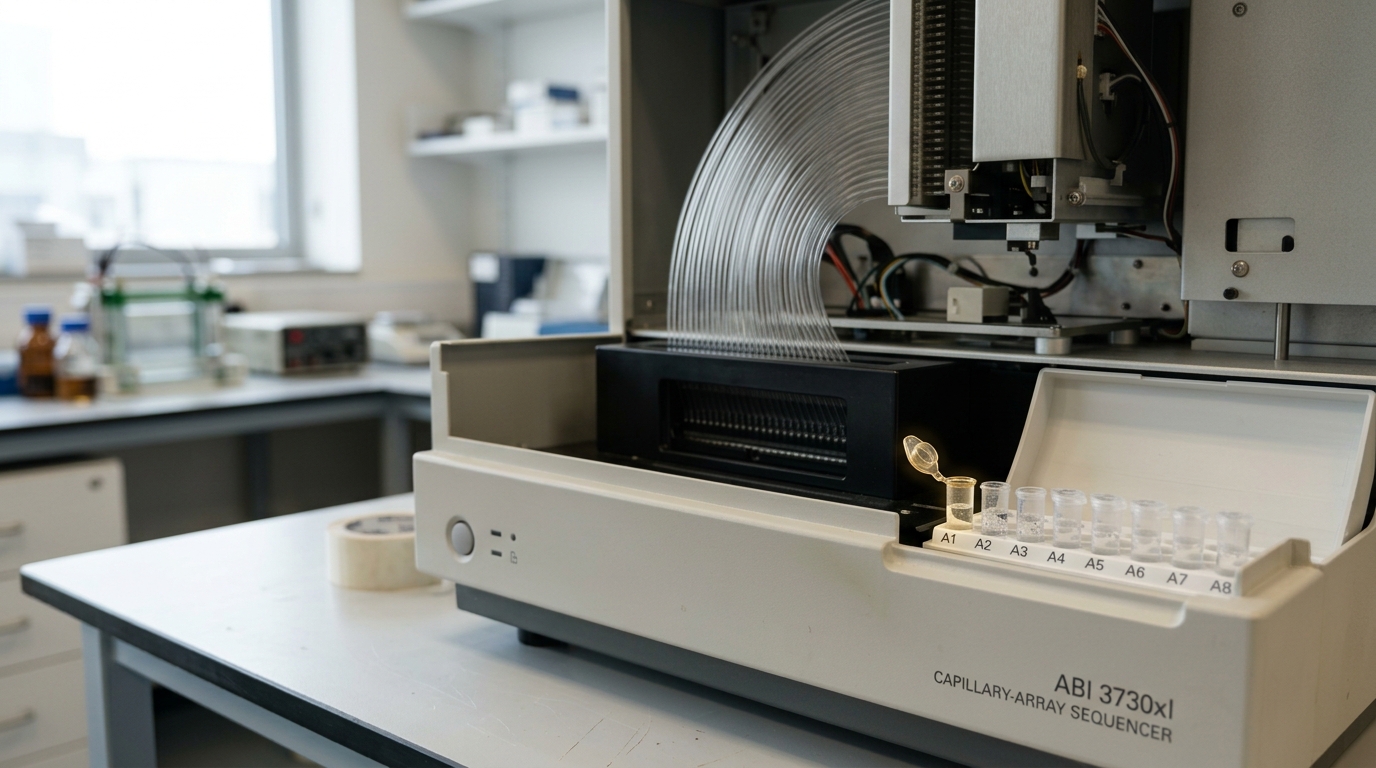
Figure 2. Capillary-array sequencers scaled reading throughput enough to draft the whole human genome by 2001 [@hgp-draft-2001]. — Image prompt and art direction by Brecht Corbeel; generation pending.
Sequencing throughput is the clearest quantitative thread running through the whole period: the shift from a slab gel reading a few hundred bases per lane to a capillary array reading tens of thousands of bases per run in parallel is a difference of roughly three orders of magnitude in a little over two decades, and it is the direct reason a single human genome went from an unthinkable undertaking to a routine clinical order within one working scientist’s career.
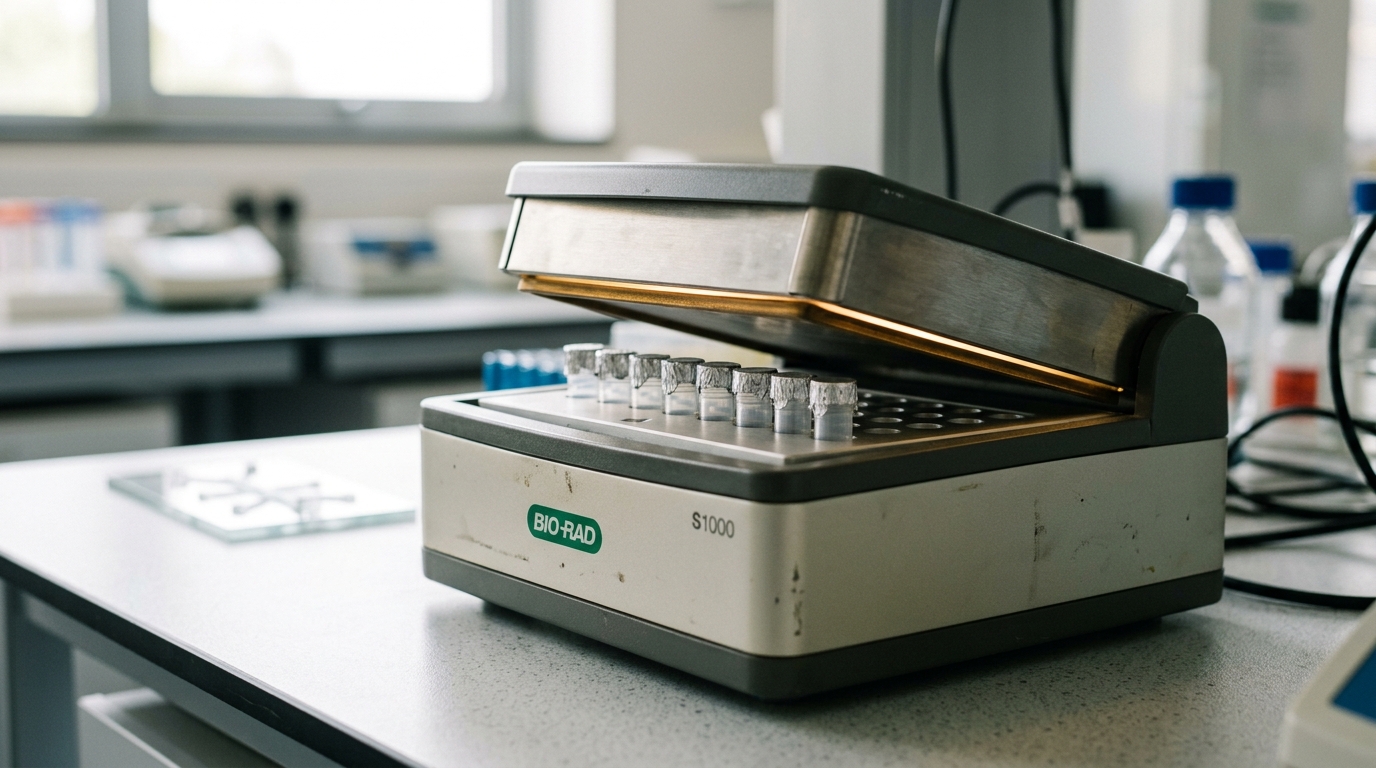
Figure 3. PCR amplification, run on thermal cyclers like this one, made every downstream genomic method possible by turning a trace of DNA into a usable quantity. — Image prompt and art direction by Brecht Corbeel; generation pending.
Every method discussed after 1985 — Sanger automation, ENCODE’s chromatin assays, CRISPR construct validation, and single-cell library preparation alike — depends on polymerase chain reaction amplification to turn a vanishingly small starting quantity of nucleic acid into enough material to measure, which is why the thermal cycler is the one instrument in this history that appears, unglamorously, inside almost every other one.
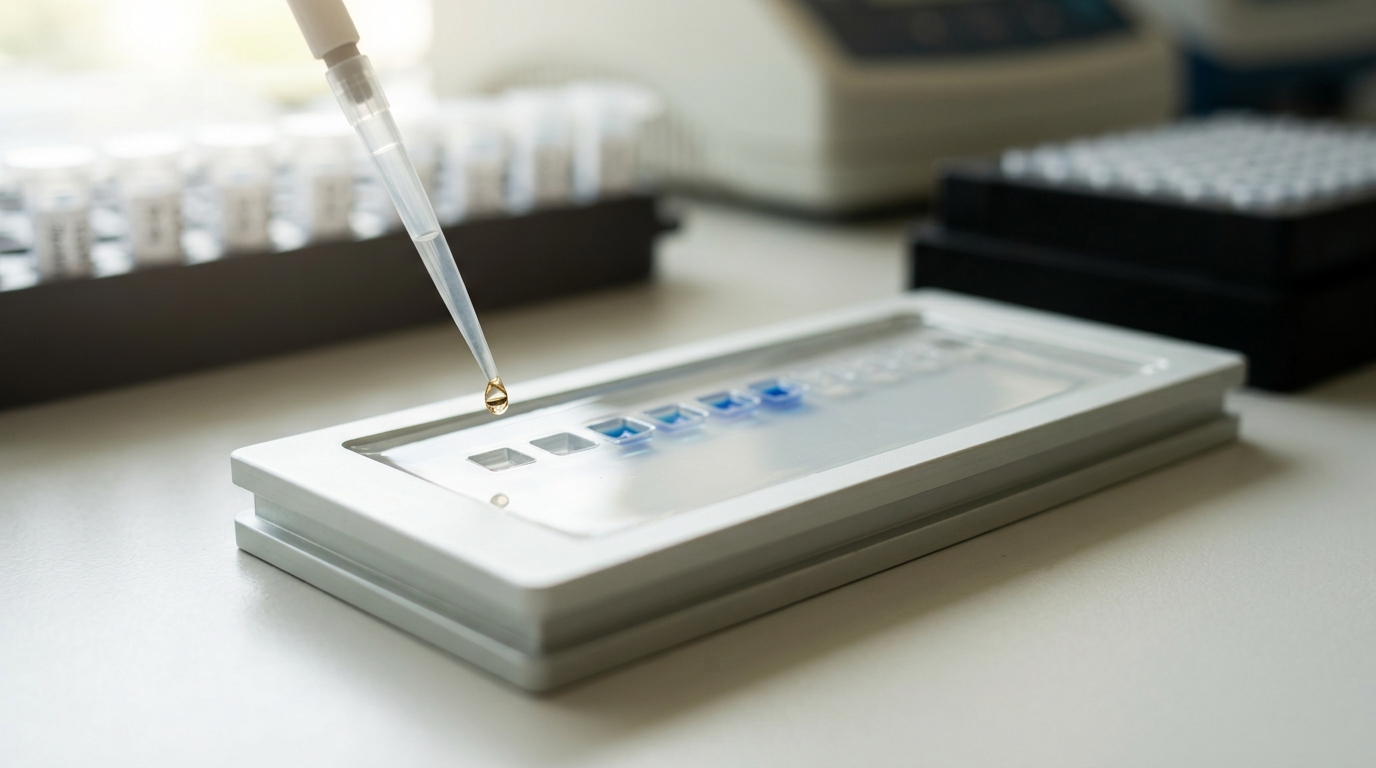
Figure 4. The 2012 demonstration that Cas9 could be re-programmed with a synthetic guide RNA turned a bacterial immune mechanism into an editing tool [@jinek-2012]. — Image prompt and art direction by Brecht Corbeel; generation pending.
The distance between the 2012 biochemical demonstration and a genuinely mature, low-off-target, tissue-general in vivo editing platform remains, honestly, an open engineering problem rather than a solved one, and treating it as solved is the specific overclaim this article has tried to flag rather than repeat.
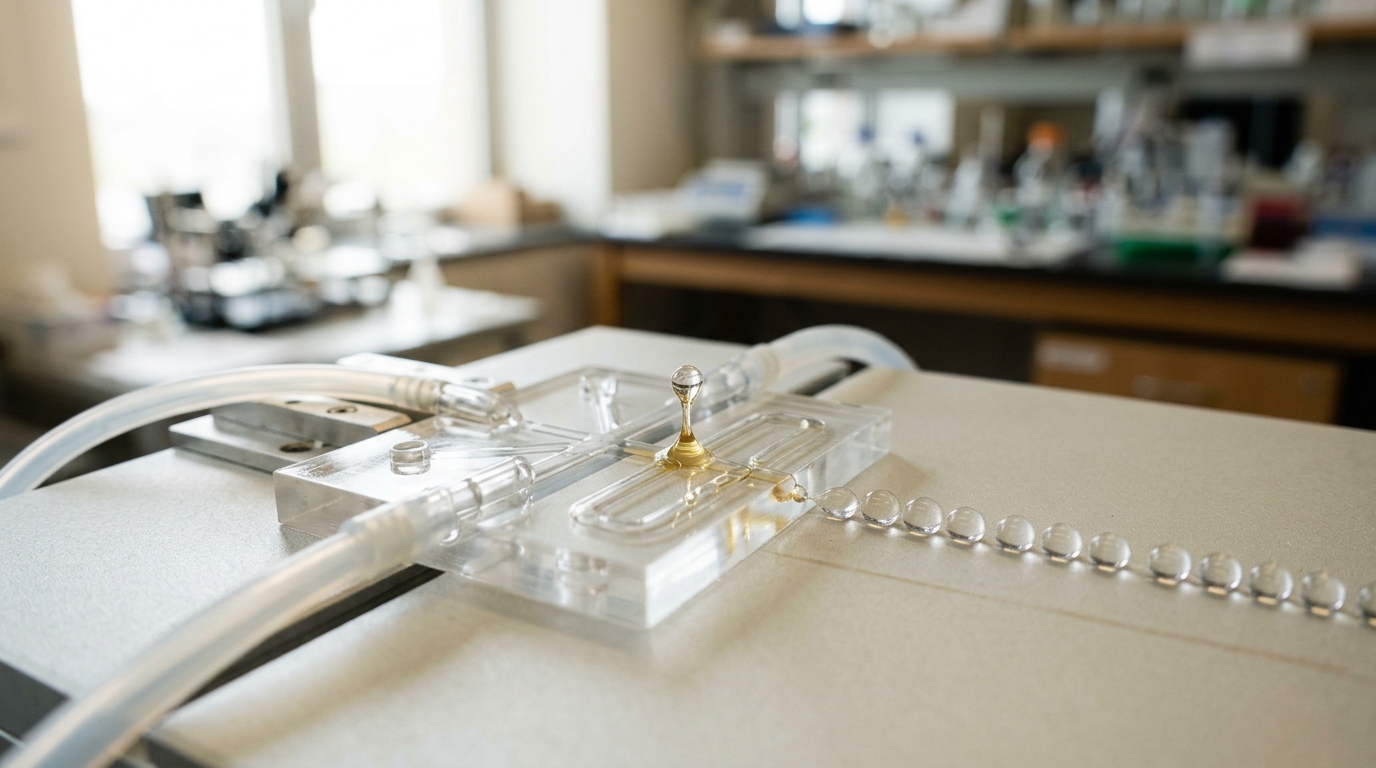
Figure 5. Droplet microfluidics let single-cell RNA sequencing scale from dozens of cells to tens of thousands, replacing a tissue average with a distribution of cell states [@macosko-dropseq-2015]. — Image prompt and art direction by Brecht Corbeel; generation pending.
If the field’s current single-cell, perturbation-paired methods hold their promise, the next major revision to this history will likely be written from the vantage of routinely paired measurement-and-intervention experiments — treating “what does this gene do” as a question answered by design, not by correlation, in the same way chain-termination sequencing once turned “what is this base” from an inference into a direct read.
Sources
- J. D. Watson and F. H. C. Crick. Molecular Structure of Nucleic Acids: A Structure for Deoxyribose Nucleic Acid. Nature (1953). DOI: 10.1038/171737a0.
- Frederick Sanger, S. Nicklen, and A. R. Coulson. DNA sequencing with chain-terminating inhibitors. Proceedings of the National Academy of Sciences (1977). DOI: 10.1073/pnas.74.12.5463.
- International Human Genome Sequencing Consortium. Initial sequencing and analysis of the human genome. Nature (2001). DOI: 10.1038/35057062.
- International Human Genome Sequencing Consortium. Finishing the euchromatic sequence of the human genome. Nature (2004). DOI: 10.1038/nature03001.
- The ENCODE Project Consortium. An integrated encyclopedia of DNA elements in the human genome. Nature (2012). DOI: 10.1038/nature11247.
- Martin Jinek, Krzysztof Chylinski, Ines Fonfara, Michael Hauer, Jennifer A. Doudna, and Emmanuelle Charpentier. A Programmable Dual-RNA-Guided DNA Endonuclease in Adaptive Bacterial Immunity. Science (2012). DOI: 10.1126/science.1225829.
- The Royal Swedish Academy of Sciences. Press release: The Nobel Prize in Chemistry 2020. NobelPrize.org (2020).
- Evan Z. Macosko, Anindita Basu, Rahul Satija, and colleagues. Highly Parallel Genome-wide Expression Profiling of Individual Cells Using Nanoliter Droplets. Cell (2015). DOI: 10.1016/j.cell.2015.05.002.
- Sue Richards and colleagues, on behalf of ACMG and AMP. Standards and Guidelines for the Interpretation of Sequence Variants: A Joint Consensus Recommendation of the American College of Medical Genetics and Genomics and the Association for Molecular Pathology. Genetics in Medicine (2015). DOI: 10.1038/gim.2015.30.
Originally published at https://absolutedigitalpublishers.com/articles/from-origins-to-frontier-a-history-of-molecular-biology-and-genomics.