Energy, Infrastructure, and Civilization in 2035: Scenarios, Signals, and Falsifiable Predictions
Grid batteries, cascading blackouts, and mineral bottlenecks are the three places where the energy transition will show its hand by 2035 — stated here as testable claims with dates and disconfirmation conditions, not vibes.
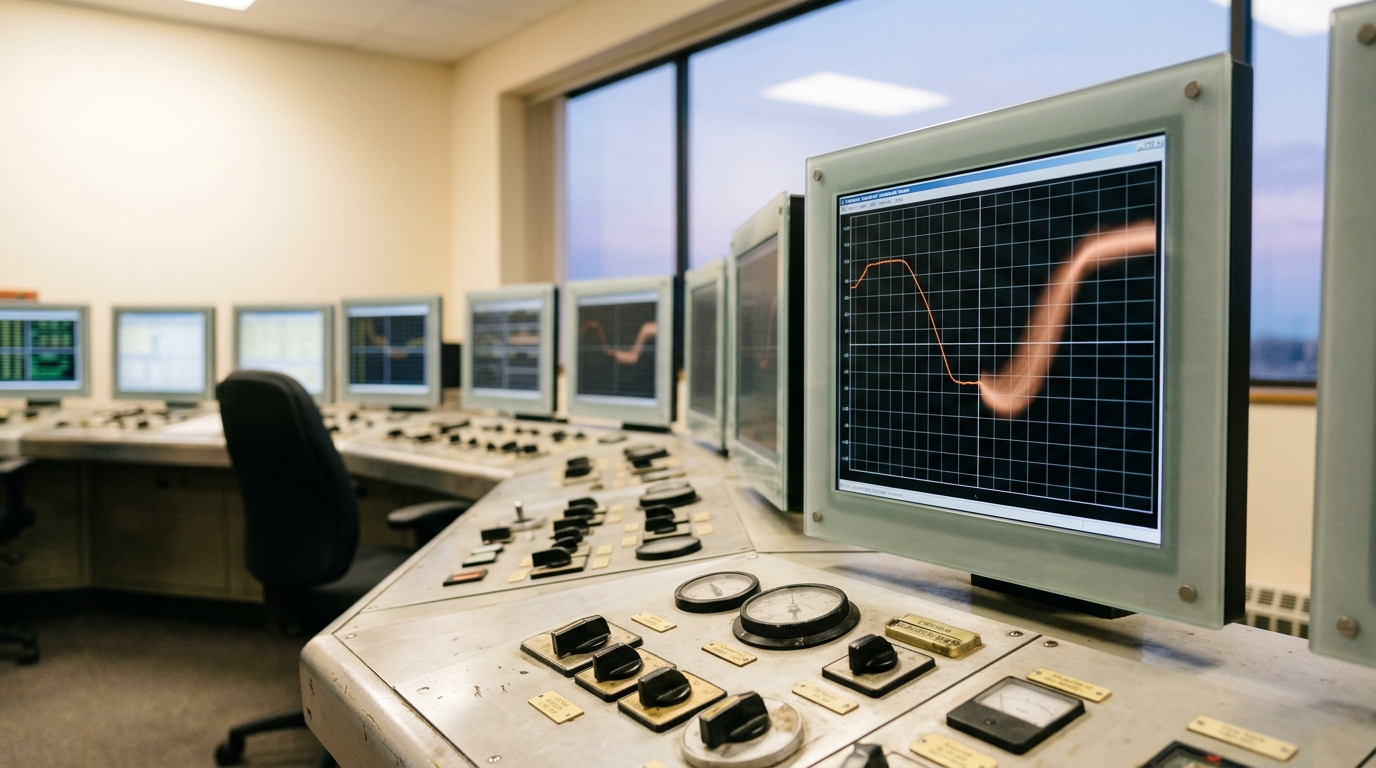
A regional grid-operations floor: the dispatch board is redrawing itself as a battery bank comes online to cover a ramping cloud front. — Image prompt and art direction by Brecht Corbeel; image generated to that direction.
Abstract
Energy systems set the ceiling on almost everything else civilization does, yet public argument about the transition mostly trades in slogans — "renewables are already cheaper" against "the grid can't handle it." This article separates verified fact from vendor claim from analysis and states three concrete, dated, falsifiable scenarios for 2035: whether battery-backed renewables underprice fossil baseload in a major grid, whether another Texas-scale cascading failure occurs, and whether critical-mineral supply concentration produces a documented bottleneck. Each scenario carries its assumptions, its observable indicators, and the specific evidence that would prove it wrong, drawn from IEA, EIA, Lazard, BloombergNEF, and the FERC/NERC Uri investigation.
Every civilization runs on a stock of usable energy and the infrastructure that moves it from where it is produced to where it is needed. That sentence sounds too obvious to write down, which is exactly why energy arguments go wrong: the plumbing is invisible until it fails, and in its place the public conversation fills up with slogans that are neither fact nor forecast — “renewables are already cheaper than everything” on one side, “the grid can’t handle it” on the other. Both statements are sometimes true, sometimes false, and almost never stated with enough precision to be wrong. This article tries to do better by being wrong in a checkable way: three scenarios about 2035, each with a horizon, explicit assumptions, an observable indicator, and a stated condition that would prove it false.
Fact, claim, analysis, scenario — kept separate on purpose
Four different kinds of sentence appear below and they are not interchangeable. A fact is a verified, cited data point: 81.5% of world primary energy consumption was fossil fuels in 2023, per the Energy Institute [7]. A vendor or institutional claim is an assertion made by an interested party that has not been independently audited to the same standard — a manufacturer’s roadmap, a lobby’s cost projection. Analysis is this article’s own reasoning connecting facts to implications, clearly flagged as reasoning rather than measurement. A scenario is a conditional statement about the future with stated premises. A prediction is a scenario the author is willing to be wrong about publicly, with a disconfirmation condition attached. Conflating these categories is the single most common failure mode in energy commentary, and this piece tries not to repeat it.
Where the system actually stands, in verified numbers
Start with the facts, because the scenarios only mean something against a baseline. Fossil fuels — coal, oil, and gas — accounted for 81.5% of global primary energy consumption in 2023, essentially unchanged in share from the prior year even as absolute renewable output grew faster than any other category [7]. That is the central, uncomfortable fact underneath every transition narrative: rapid percentage growth in a still-small base does not by itself change the composition of the whole system. Renewables were forecast to supply more than a third of global electricity generation in 2025, overtaking coal in that one narrower category, according to the IEA [1] — but electricity is only about a fifth of final energy consumption worldwide; transport fuel, industrial heat, and petrochemical feedstock are harder to electrify and remain overwhelmingly fossil-supplied. Two different claims — “renewables passed coal in electricity” and “the fossil share of total energy fell” — are both being made in public discourse, and only one of them is currently true.
On the electricity side specifically, the IEA’s central scenario has global electricity demand rising roughly 40% by 2035, driven by cooling, electrified transport, and data centers, with renewables meeting about 95% of that incremental demand growth and reaching close to 55% of total generation by 2035 [1]. Read carefully: that is a scenario, not a fact, and it is the IEA’s own STEPS (“Stated Policies”) projection — a defensible central estimate built on announced policy, not a certainty. Data centers and AI workloads, often blamed for grid strain, account for under a tenth of projected global electricity demand growth even as they double in absolute terms in the U.S., China, and the EU — cooling and electrification of transport are larger drivers [1].
On storage costs, the facts are moving fast enough that any number printed here should carry its measurement date. BloombergNEF’s 2025 survey put average lithium-ion battery pack prices at $108 per kilowatt-hour, down 8% from 2024, with stationary-storage-specific packs falling to $70/kWh — a 45% one-year drop driven by cell overcapacity and the shift to lower-cost lithium iron phosphate chemistry [5]. Lazard’s 2025 levelized-cost analysis found the levelized cost of storage (LCOS) for a 100 MW, four-hour utility-scale standalone battery system ranging from $115 to $254 per megawatt-hour, back down to roughly 2020 levels after several years of pandemic- and metals-driven increases [2]. NREL’s own cost-projection work corroborates a continued downward trajectory for utility-scale storage hardware [9]. In the United States, utility-scale battery capacity grew 66% in 2024 alone, crossing 26 gigawatts of cumulative installed capacity, with EIA reporting operator plans for a further 19.6 GW addition in 2025 — solar and storage together projected to account for 81% of new U.S. generating capacity that year [6, 8].

Figure 1. A battery-cycling test bay: most cell drawers are seated and running, one still partway into its slot mid-test. — Image prompt and art direction by Brecht Corbeel; generation pending.
On grid reliability, the reference event remains Winter Storm Uri. Over February 8–20, 2021, extreme cold across Texas and the South Central U.S. produced sustained generation outages that peaked near 34,000 MW — roughly half of ERCOT’s all-time winter peak load — and the joint FERC/NERC investigation attributed 44% of unplanned outages, derates, and failed starts to equipment freezing, with fuel-supply interruption and mechanical/electrical failure as the other primary causes [3]. The investigation issued 28 formal recommendations, mostly around mandatory winterization standards and gas-electric coordination — recommendations that are themselves a fact (they were issued) but whose implementation is a separate, ongoing question this article treats as an open indicator, not a settled fact.
On minerals, the IEA’s 2025 outlook found that the top three producing countries’ combined share of critical-mineral mining — cobalt, copper, graphite, lithium, nickel, and rare earths together — rose to 86% in 2024 from about 82% in 2020, a concentration increase even as lithium mining itself diversified toward Argentina and Zimbabwe [4]. Refining is far more concentrated than mining: the IEA projects China supplying over 60% of refined lithium and cobalt and roughly 80% of battery-grade graphite and rare earth elements by 2035 under current trajectories [4]. Separately, announced lithium mine-supply projects were assessed as meeting only about half of anticipated 2035 lithium demand [4] — a genuine, sourced supply gap, distinct from the geopolitical concentration point, and worth keeping distinct because they imply different failure modes: one is a volume shortfall, the other is a chokepoint risk.
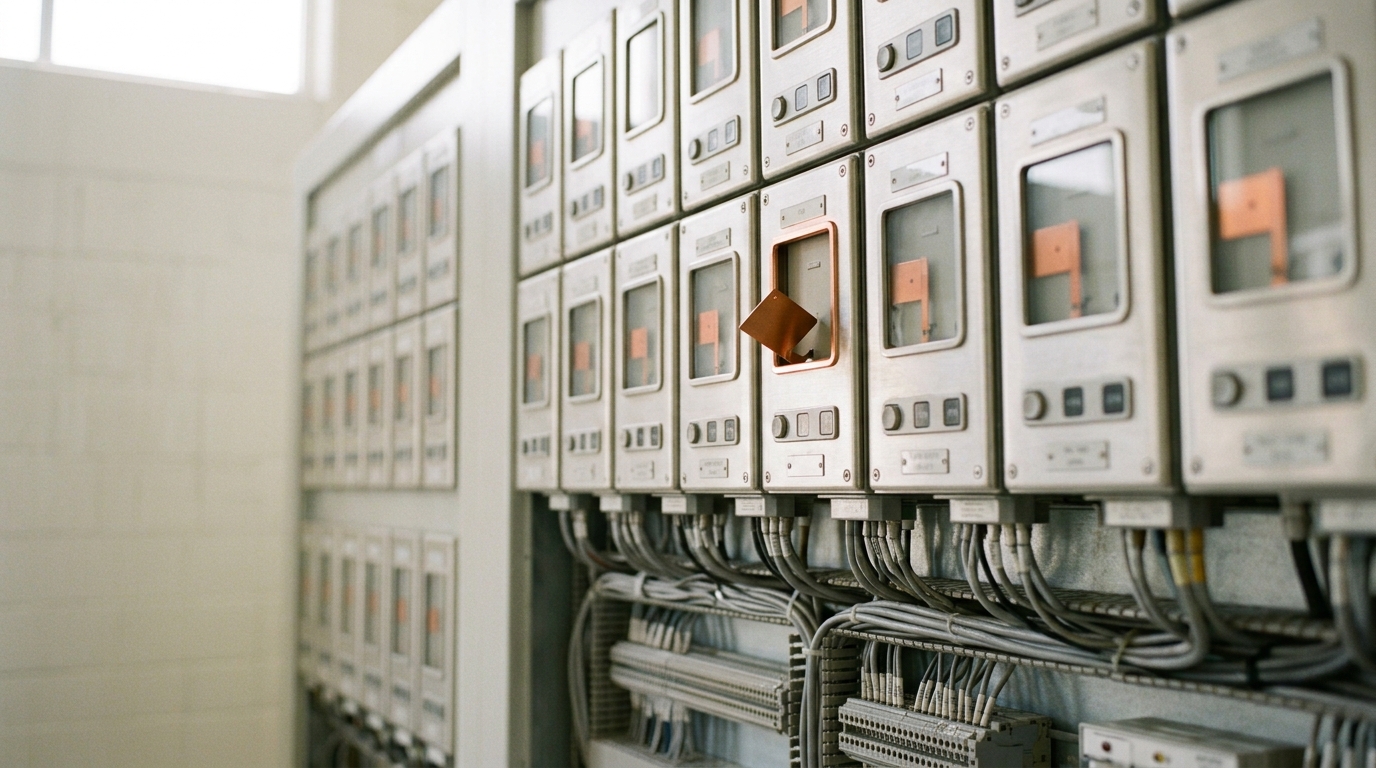
Figure 2. A substation relay-protection panel: most breakers show a steady state, one trip flag is still swinging into position. — Image prompt and art direction by Brecht Corbeel; image generated to that direction.
Scenario one: does battery-backed renewable generation underprice fossil baseload in a major grid by 2035?
Horizon: by December 31, 2035, in at least one grid serving more than 10 million people (e.g., ERCOT, PJM, California ISO, or a comparable non-U.S. system).
Assumptions: (1) storage costs continue falling at something like the trajectory measured 2023–2025 — a continuation, not a certainty, since prices have swung both up and down over the past six years on metals-cost and demand shocks [5]; (2) no major new tariff or trade restriction on battery cells and critical minerals large enough to reverse the price trend; (3) grid interconnection queues clear fast enough for storage buildout to actually reach the pace operators report — a real bottleneck today, since announced project pipelines and delivered capacity are not the same thing.
Observable indicators between now and 2035: published LCOS for 4-hour-plus storage paired with renewables falling below the marginal operating cost of the grid’s newest combined-cycle gas plants in the same market, sustained across at least two consecutive annual Lazard-style surveys, not a single data point; utility integrated resource plans in that grid explicitly citing storage-plus-renewables as cheaper than a new gas peaker rather than merely “competitive”; a documented case of a grid operator retiring or deferring a planned gas plant with cost, not policy, cited as the primary reason.
Disconfirmation condition: the scenario is falsified if, by the 2035 horizon, no major grid has published operator or regulator documentation showing battery-backed renewables underpricing new fossil baseload on a levelized basis, or if battery/mineral costs have measurably reversed course for three or more consecutive years for reasons other than a one-off disruption.
Analysis, not fact: the 2025 storage cost data are consistent with this happening — LCOS for utility storage has round-tripped back to 2020 levels after a metals-driven spike, and Lazard’s own multi-year series shows the gap to gas-plant LCOE narrowing [2, 5]. But “consistent with” is not “on track for”: interconnection queues, permitting timelines, and the mineral-supply constraints discussed in scenario three could all independently slow the pace regardless of unit cost. This is a genuinely open question, not a settled trend extrapolated forward.

Figure 3. A critical-minerals assay bench: a lithium-brine sample is caught mid-pour into the analyzer tray, the previous sample already logged. — Image prompt and art direction by Brecht Corbeel; image generated to that direction.
Scenario two: does a major grid experience another documented multi-cause cascading failure comparable to 2021 Texas by 2035?
Horizon: by December 31, 2035, in any grid with a comparable population-and-load scale to ERCOT’s 2021 event (roughly 25 million people, tens of gigawatts of peak load).
Assumptions: (1) extreme weather events — cold snaps, heat domes, or storms — continue occurring at a frequency at least comparable to the past decade; (2) grid operators do not achieve full winterization or equivalent weatherization coverage across generation fleets in vulnerable regions within the horizon; (3) “comparable” is defined narrowly as an independent post-event investigation (FERC/NERC-equivalent or a national regulator) attributing outages to multiple independent causes — equipment failure, fuel-supply interruption, and demand surge acting together — rather than any single-cause blackout, which is a different and more common event.
Observable indicators: the pace and completion rate of the 28 FERC/NERC winterization recommendations issued after Uri [3]; whether mandatory (versus voluntary) winterization standards are actually enacted and enforced in ERCOT and comparable grids; frequency of near-miss events — emergency alerts, rolling blackouts short of full cascading failure — as a leading indicator, tracked by NERC’s own reliability assessments.
Disconfirmation condition: falsified if, by 2035, no grid of comparable scale has had an independently investigated multi-cause cascading failure, and documented near-miss frequency has measurably declined relative to the 2015–2025 baseline — the second clause matters, because the mere absence of a single dramatic event over ten years is weak evidence if near-misses kept climbing.
Analysis, not fact: the FERC/NERC report is unambiguous that the 2021 event’s causes were structural and known in advance — the same grid had a smaller cold-weather event in 2011 with similar root causes and similar recommendations that were not fully implemented before 2021 [3]. That repetition is itself the strongest piece of evidence for treating another cascading event as a live possibility rather than a tail risk: the disconfirming condition here (full enforced weatherization plus declining near-miss rates) is a meaningfully high bar, and it is analysis, not fact, to expect it will be only partially met by 2035.
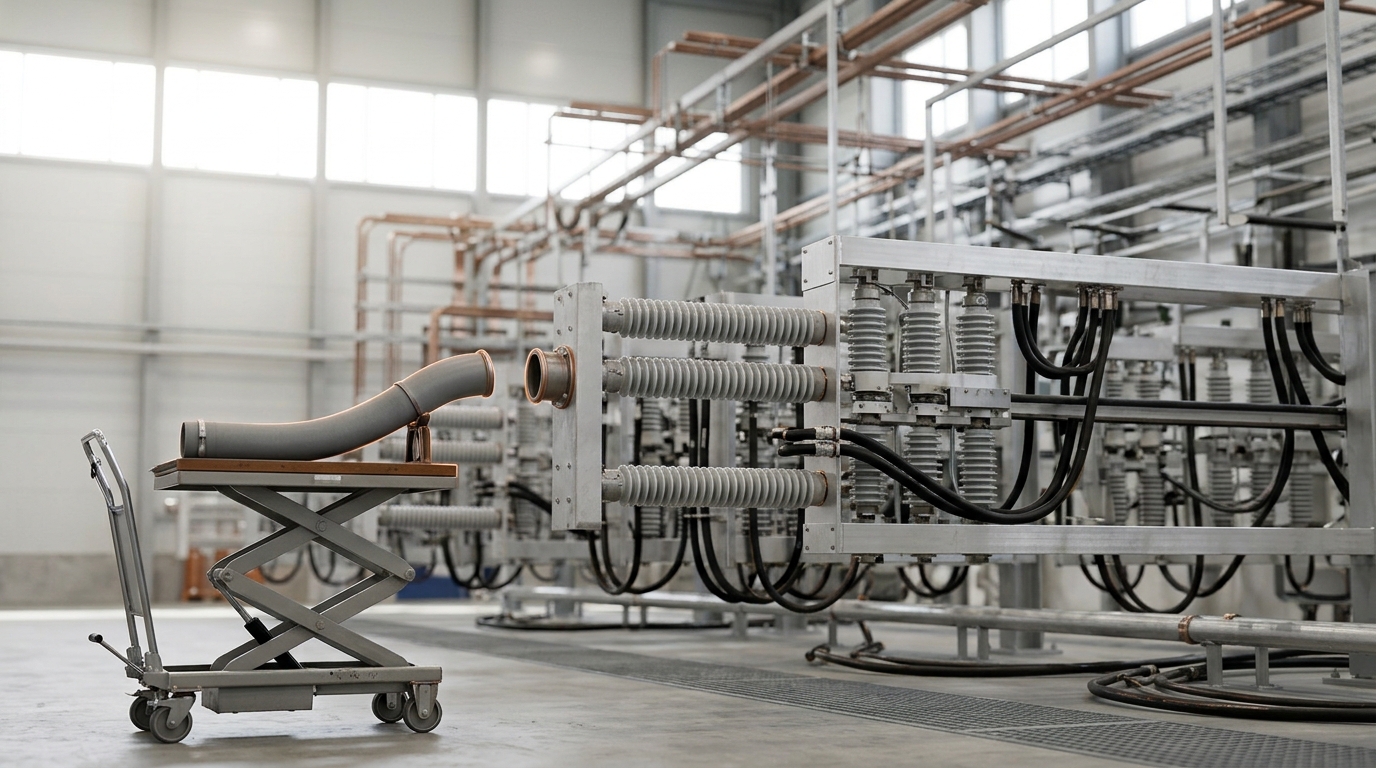
Figure 4. An HVDC converter hall: a technician's lift cart has just set a valve-cooling hose partway onto its manifold fitting. — Image prompt and art direction by Brecht Corbeel; image generated to that direction.
Scenario three: does critical-mineral throughput for the energy transition create a documented supply bottleneck by 2035?
Horizon: by December 31, 2035, for at least one mineral in the IEA’s core transition basket (lithium, cobalt, nickel, copper, graphite, rare earths).
Assumptions: (1) global battery and grid buildout continues at something resembling current trajectories, so demand growth does not stall for unrelated macroeconomic reasons; (2) no major substitution breakthrough (e.g., sodium-ion at scale displacing lithium demand materially) fully offsets projected demand growth for the mineral in question; (3) “bottleneck” is defined as a sustained price spike of 600% or more year over year, an export restriction with measurable global supply impact, or a documented multi-quarter shortfall against contracted delivery volumes — not merely a forecasted future gap, which several outlooks already state.
Observable indicators: the IEA’s own finding that announced lithium mine-supply projects meet only about half of projected 2035 demand [4] is a leading indicator already on the record; refining concentration — over 60% of refined lithium and cobalt and roughly 80% of battery-grade graphite and rare earths from one country by 2035 in the IEA’s projection [4] — is a chokepoint indicator distinct from the mining-volume indicator; any new export-licensing regime on battery-grade materials functions as an early trigger to watch.
Disconfirmation condition: falsified if, by 2035, no basket mineral has experienced a documented price spike, export-restriction event, or multi-quarter contracted-delivery shortfall attributable to supply concentration or throughput limits — i.e., if diversification (the lithium case, where new entrants like Argentina and Zimbabwe already measurably lowered top-three concentration [4]) generalizes to the other basket minerals faster than demand growth outpaces new supply.
Analysis, not fact: the top-three mining concentration figure moving from 82% to 86% between 2020 and 2024 is measured, but it is analysis — not fact — to read that as evidence a bottleneck is coming rather than evidence that diversification (lithium) and concentration (cobalt, copper, nickel) are simply moving in different directions for different minerals, which the same IEA report states explicitly [4]. Treating “critical minerals” as one undifferentiated risk category is exactly the kind of imprecision this article is trying to avoid.
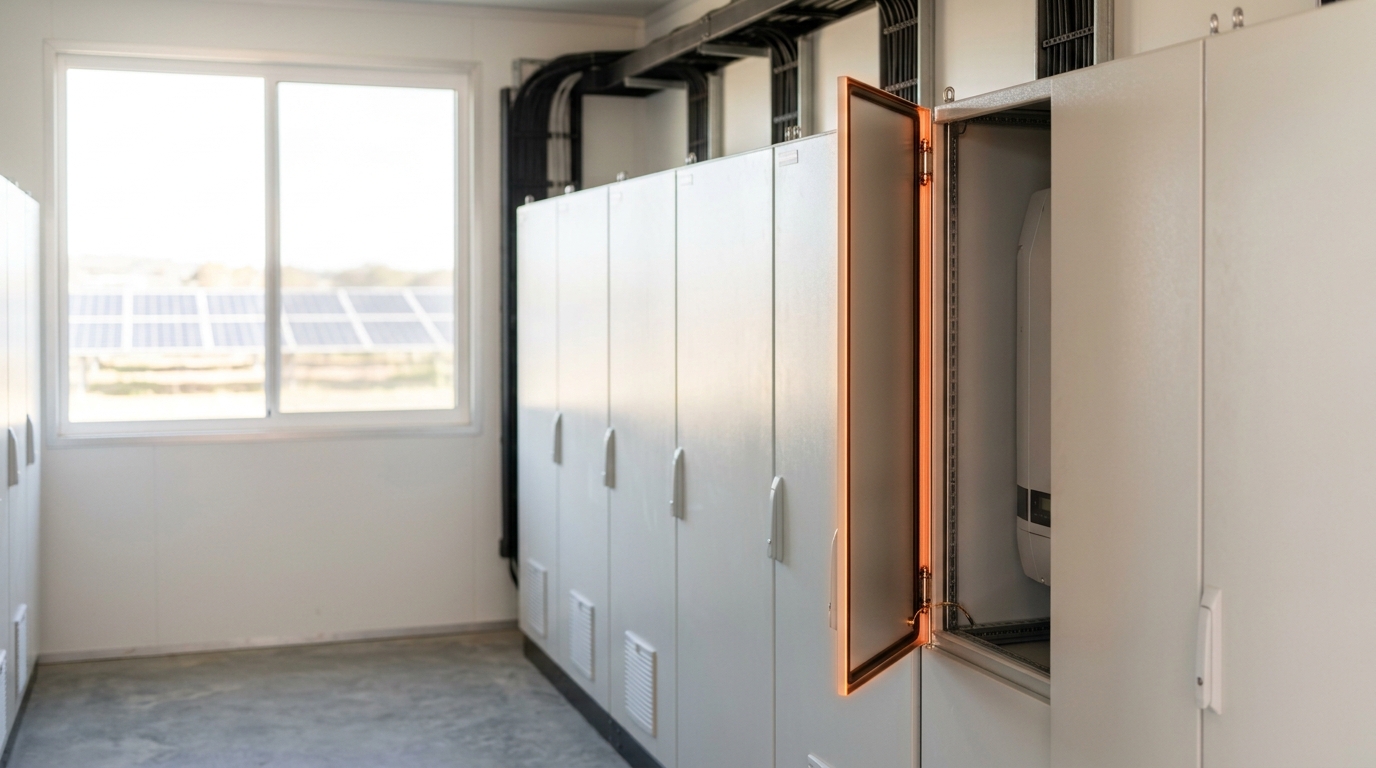
Figure 5. A hybrid solar-and-storage plant control shed: an inverter cabinet door is caught mid-swing, not yet latched, after a routine inspection. — Image prompt and art direction by Brecht Corbeel; image generated to that direction.
What would actually change the argument
None of these three scenarios resolves cleanly before 2030; that is the point of setting a 2035 horizon rather than making a claim checkable next quarter. But each has near-term tells worth watching now. For scenario one, watch whether Lazard’s and BloombergNEF’s next two annual surveys continue the 2024–2025 storage-cost decline or reverse it — a single year’s drop following a multi-year spike is not yet a trend [2, 5]. For scenario two, watch whether ERCOT and peer grids actually complete mandatory winterization audits rather than voluntary compliance filings — the gap between a recommendation being issued and being enforced is exactly where the 2011-to-2021 repetition happened once already [3]. For scenario three, watch the refining-concentration numbers specifically, separately from the mining-concentration numbers, since the IEA’s own data shows they are moving in different directions for different minerals [4].
The broader claim this article is willing to defend is narrower than either side of the public argument: energy transitions are neither a solved problem awaiting deployment nor an impossibility being oversold. They are a set of specific, measurable races — cost curves against interconnection queues, weatherization mandates against extreme-weather frequency, mineral diversification against demand growth — each of which could plausibly go either way by 2035, and each of which will leave a paper trail before it does. The honest position is to name the races, not to call them in advance.
Why the wrong scale of question keeps getting asked
Part of why energy debate stays stuck at the level of slogan is that the natural unit of the conversation — “is the transition working” — is not a question any single number can answer. A national grid operator, a mining company, and a household choosing a heat pump are each making decisions on different time horizons against different constraints, and aggregating them into one yes-or-no framing throws away exactly the information that would make a prediction falsifiable. The three scenarios above were chosen because each corresponds to a decision some specific, identifiable institution has to make on a specific schedule: a regulator approving or rejecting a resource plan, a reliability body auditing winterization compliance, a mining permitting authority approving or delaying a new mine. Predictions anchored to an institutional decision point carry a natural falsification test — either the plan was approved on the stated grounds or it wasn’t, either the audit found compliance or it didn’t — in a way that predictions anchored to diffuse concepts like “the transition” cannot.
That same discipline is worth applying backward, to the sources this piece leans on. The IEA’s STEPS scenario is a policy-based projection built from governments’ stated commitments, not a physical law, and it has been revised in both directions in past editions as policy and cost data changed [1]. Lazard’s and BloombergNEF’s cost surveys are snapshots of a market that has already reversed direction once this decade under metals-cost pressure, so a single favorable year is evidence of a data point, not proof of a locked-in trend [2, 5]. The FERC/NERC report is the strongest-standing source in this set precisely because it is a retrospective, primary investigation rather than a forecast — which is also why it can only describe what already happened, not guarantee what happens next. Reading all three kinds of source with an eye on what kind of claim they are actually entitled to make is not a footnote to this argument; it is most of the argument.
Sources
- International Energy Agency. World Energy Outlook 2025. IEA (2025).
- Lazard. Levelized Cost of Energy+ (LCOE+) 2025. Lazard (2025).
- FERC, NERC, and Regional Entity Staff. The February 2021 Cold Weather Outages in Texas and the South Central United States. Federal Energy Regulatory Commission / North American Electric Reliability Corporation (2021).
- International Energy Agency. Global Critical Minerals Outlook 2025. IEA (2025).
- BloombergNEF. Lithium-Ion Battery Pack Prices Fall to $108 Per Kilowatt-Hour, Despite Rising Metal Prices. BloombergNEF (2025).
- U.S. Energy Information Administration. U.S. battery capacity increased 66% in 2024. EIA (2024).
- Energy Institute, KPMG, and Kearney. Statistical Review of World Energy 2024. Energy Institute (2024).
- U.S. Energy Information Administration. Solar, battery storage to lead new U.S. generating capacity additions in 2025. EIA (2025).
- National Renewable Energy Laboratory. Cost Projections for Utility-Scale Battery Storage. NREL (2025).
Originally published at https://absolutedigitalpublishers.com/articles/energy-infrastructure-and-civilization-in-2035-scenarios-signals-and-falsifiable-predictions.