Cities Are Organisms That Refuse to Die: Urban Evolution to 2100
Cities almost never die, for structural reasons: scaling laws that reward density, buried infrastructure that locks in past decisions, and a demographic geography now centred on Africa. Every claim about 2100 below is named to whoever is making the forecast.
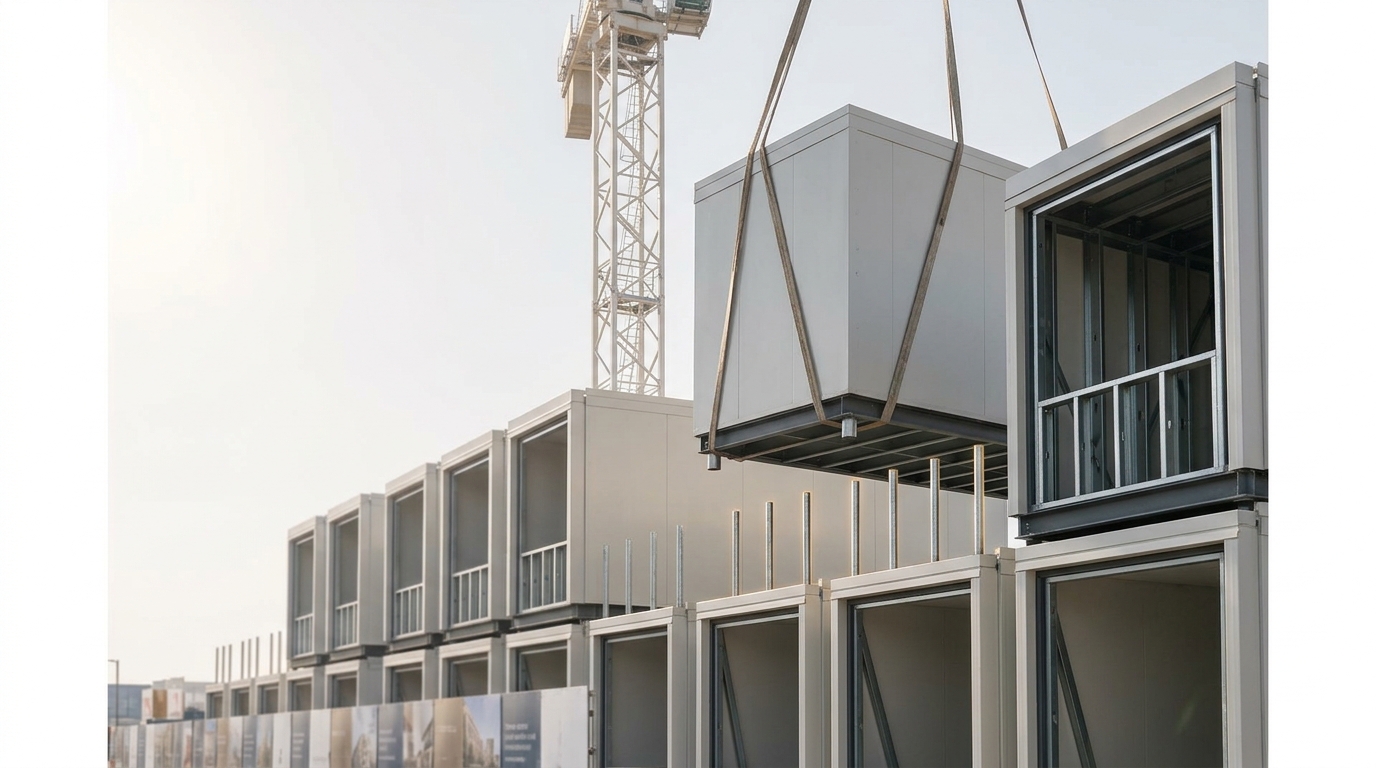
Almost every city that survives to 2100 will have gone through this exact negotiation many times over: what gets kept standing, what gets rebuilt behind it, and what has to be dug up to change. — Image prompt and art direction by Brecht Corbeel; generation pending.
Abstract
Cities are the longest-lived artifacts complex human institutions build, for structural rather than sentimental reasons. This article traces four arguments: the contrast between near-immortal cities and short-lived firms (a roughly ten-year firm half-life against Japanese cities that recovered their pre-war relative sizes after wartime destruction); the urban scaling laws Bettencourt and colleagues documented in 2007 and the empirical challenge to their universality, alongside evidence the same pattern appears in a pre-industrial Mesoamerican settlement system; buried infrastructure as a physical ratchet, using Arthur's 1989 lock-in and current infrastructure-cost figures; and the demographic geography of the urban century from UN projections and a named 2100 extrapolation, read against managed-retreat literature and Jakarta's verified land subsidence and capital relocation. It closes with two falsifiable 2100 scenarios for how retrofit and greenfield growth divide the urban future.
Cities almost never die; the balance sheets built inside them do
A publicly traded company chosen at random has roughly even odds of being gone within about a decade. Daepp, Hamilton, West and Bettencourt tracked more than twenty-five thousand North American public companies from 1950 to 2009 and found a half-life of approximately ten years, with three separate survival estimators converging on ten to twelve years and a fourth, cruder method giving seven [3]. The more surprising finding is not the half-life itself but its shape: the hazard rate is close to constant across firm age, meaning a company that has already survived forty years faces almost the same annual odds of disappearing as one founded last quarter. Neither the “liability of newness,” in which young firms are assumed to be the fragile ones, nor the “liability of senescence,” in which age itself becomes the liability, holds up against the data. Companies do not die of old age. They are simply, continuously, at risk, mostly through mergers and acquisitions (45.1 percent of exits) rather than through outright failure — bankruptcy accounted for only 4.5 percent [3].
Cities do not behave anything like this. The cleanest natural experiment on record is not a statistical model of ordinary attrition but a study of what happens when a city is bombed nearly out of existence. Davis and Weinstein used Japanese regional population data spanning, in their own description, “from the Stone Age through contemporary times,” and treated Allied wartime bombing — including the atomic destruction of two cities — as an exogenous shock to test three competing theories of why economic activity sits where it sits [5]. Their finding, in their own words: “long-run city size is robust even to large temporary shocks” [5]. Populations that had been devastated to a fraction of their prewar size returned, within a few postwar decades, to almost exactly the relative rank each city held before the war. The site persisted. The specific buildings, the specific firms, the specific residents did not need to; what came back was the place’s position in a national hierarchy of places, as if the location itself were the durable unit and everything built on it in any given decade were merely current occupancy.
This does not mean cities never shrink or never lose people. The United Nations’ 2025 revision of the World Urbanization Prospects — the first to use a new “Degree of Urbanization” methodology distinguishing cities, towns and rural areas along one continuum — records that more than three thousand cities worldwide lost population between 2015 and 2025, most of them under 250,000 residents, with more than a third of the shrinking cities in China and seventeen percent in India [8]. Shrinkage is common. What almost never happens is the second step: a city’s site being abandoned outright, its street pattern erased, its location returned to non-urban land use. The distinction matters for everything that follows in this article, because the near-immortality this piece is named for is a claim about persistence of place, not about permanent growth, and the two are frequently confused in popular writing about “dying cities.” A city that has lost half its population over fifty years and a city with no population at all are, for the purposes of the argument below, almost entirely different phenomena. Only the second is genuinely rare.
Why the asymmetry between a company’s ten-year half-life and a city’s near-total durability exists is not obvious from either study alone. Companies are legal fictions that can be dissolved by a signature; a city is millions of decisions about where pipes run, where deeds are registered and where the next building’s foundation gets poured, each decision made cheaper by every decision that came before it. The rest of this article works through that mechanism directly — first the scaling laws that describe what a city’s size buys it, then the physical infrastructure that makes a city’s location so expensive to abandon, then the demographic geography that will decide where most of humanity’s urban fabric gets built between now and 2100, and finally two named, falsifiable scenarios for how that fabric divides between the two competing strategies visible on any construction site today: keep the shell and rebuild behind it, or start again on unbuilt ground.
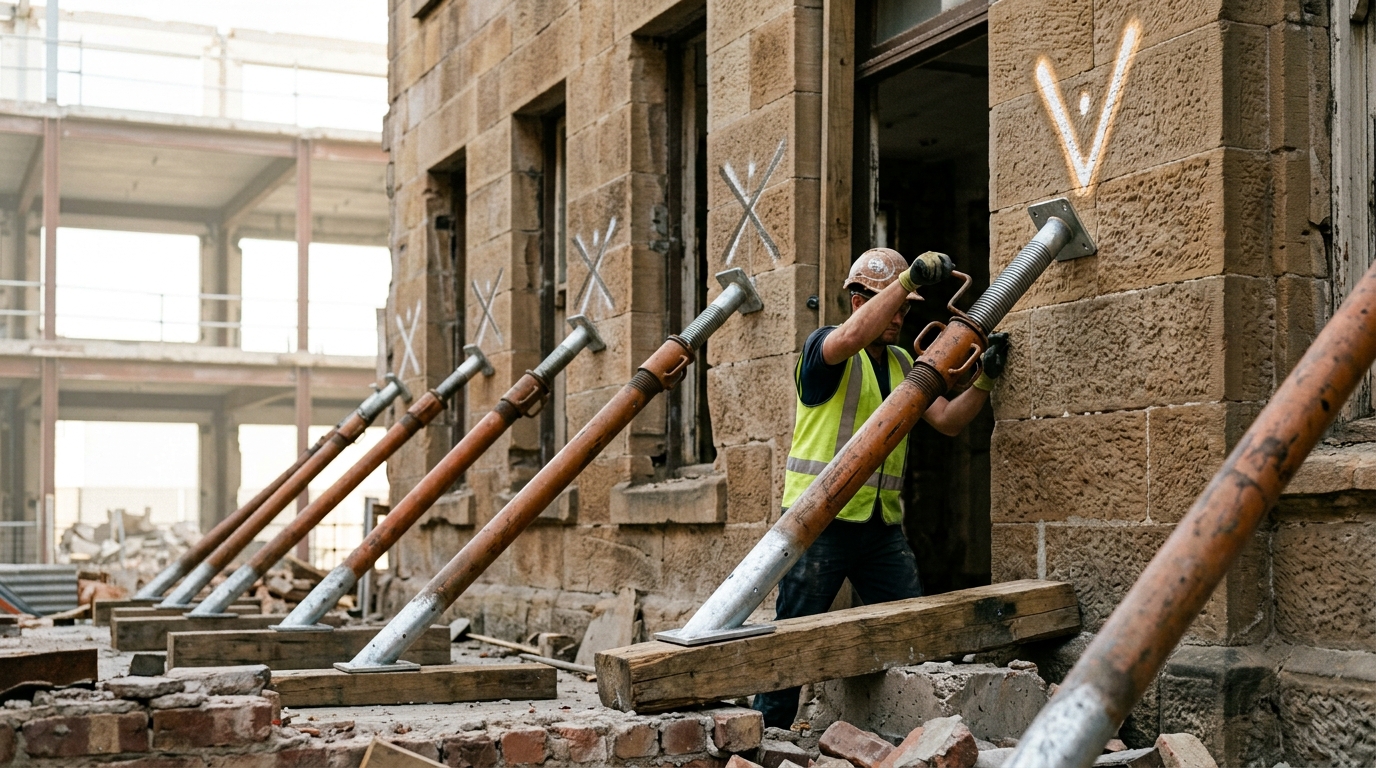
Figure 1. What a city keeps standing rarely outlives the reasons it was built; the shell persists because replacing it costs more than propping it up, not because anyone still needs what it originally housed. — Image prompt and art direction by Brecht Corbeel; generation pending.
Two exponents describe what a city’s size buys it, and the exponents are disputed
In 2007, Bettencourt, Lobo, Helbing, Kühnert and West published a cross-sectional analysis of American metropolitan statistical areas that has since become the standard citation for the claim that cities obey scaling laws. Measured against city population, quantities tied to innovation and economic output scale superlinearly — new patents scaled with an exponent of 1.27, inventors 1.25, private research and development employment 1.34, GDP in a range of 1.15 to 1.26, total wages 1.12, even serious crime 1.16 — while quantities tied to physical infrastructure scale sublinearly: length of electrical cable 0.87, road surface 0.83, gasoline stations 0.77, gasoline sales 0.79 [1]. In the compact notation the paper made famous, a quantity Y relates to population N as
Y(N) = Y_0 \, N^{\beta}
where \beta \approx 1.15 for the socioeconomic quantities and \beta \approx 0.85 for the infrastructural ones. A city twice the size of another does not simply have twice the patents and twice the roads; it tends to have somewhat more than twice the patents and somewhat less than twice the road surface. The paper’s own framing is worth stating precisely, because it is often flattened into a slogan: doubling a city’s population is associated with roughly a fifteen percent bonus in per-capita innovation and wealth, and a corresponding roughly fifteen percent saving in per-capita infrastructure, at the same time. This is the opposite of how biological organisms scale — an elephant’s metabolism runs slower, gram for gram, than a mouse’s, and larger organisms generally do less per unit of mass, not more. Bettencourt and colleagues note explicitly that cities invert this pattern: the pace of social and economic life increases with size rather than slowing down, which is the empirical basis, and the important qualifier, behind any comparison between cities and biological organisms — the resemblance is in persistence and inheritance, argued through the rest of this article, not in metabolic scaling.
Whether these exponents describe a genuine, near-universal law of cities, or an artifact of how a particular country’s statistical agencies happen to draw city boundaries, is a live and unresolved dispute rather than a settled footnote. Arcaute, Hatna, Ferguson, Youn, Johansson and Batty constructed thousands of alternative systems of cities for England and Wales, varying the boundary definitions used to decide where one city ends and another begins, and found that “when non-linear correlations are present, the exponent fluctuates considerably” and that “population size alone does not provide enough information to describe or predict the state of a city” [2]. Their most pointed finding is that most urban indicators scale close to linearly once boundary definitions are handled carefully and consistently — which, if it generalizes beyond England and Wales, would mean the superlinear “increasing returns to city size” result is at least partly a consequence of choosing city boundaries in a way that happens to produce it, rather than a discovered law of urban systems independent of how cities are drawn on a map. Bettencourt and colleagues’ original result and the Arcaute critique are both peer-reviewed, both methodologically serious, and not straightforwardly reconcilable; a reader should take from this that the scaling relationship is real enough to keep being found, replicated and argued about across many data sets, but not settled enough to extrapolate mechanically to any specific city’s future, and certainly not settled enough to license the kind of confident numerical forecasting that smart-city vendor material routinely built on top of it in the years after 2007.
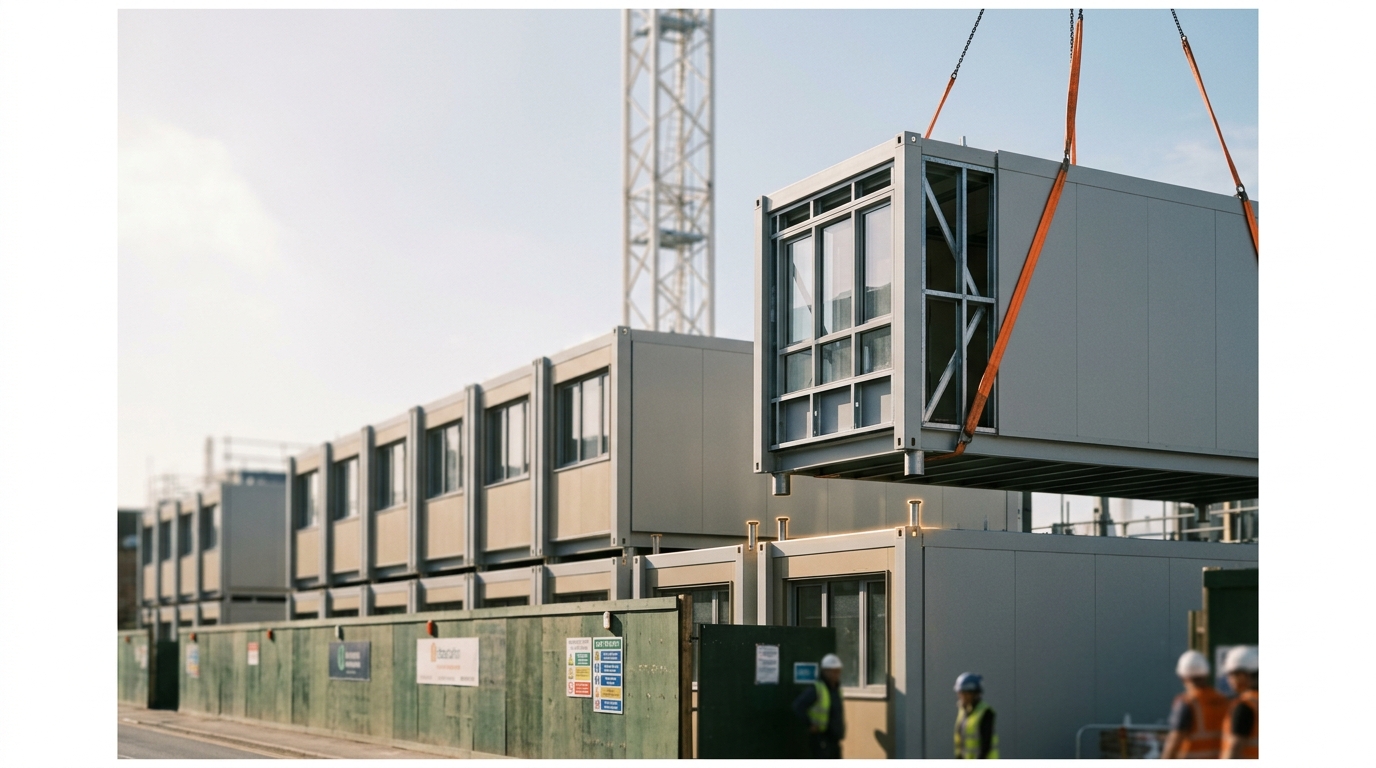
Figure 2. Growth like this is what a superlinear exponent actually looks like on the ground: each added module both needs and generates more than the last one did, which is a claim about output, not about how the module gets built. — Image prompt and art direction by Brecht Corbeel; generation pending.
One further result narrows the dispute in an interesting direction rather than resolving it outright, and it is the piece of evidence that makes the scaling-law argument load-bearing for an evolutionary account of cities rather than simply a curiosity about American metro statistics. Ortman, Cabaniss, Sturm and Bettencourt tested the same superlinear-versus-sublinear pattern against a completely different technological substrate: the pre-Hispanic settlement system of the Basin of Mexico, spanning the Formative, Classic, Toltec and Aztec periods from roughly 1150 BCE to 1520 CE — a society with no cars, no electrical grid, no modern firm structure and no shared institutional lineage with twentieth-century Chicago or Tokyo. They found public monument construction scaling with an exponent of 1.177, close to the paper’s own theoretically predicted value of seven-sixths, and total domestic-output measures scaling at roughly 1.19, essentially the same superlinear signature Bettencourt’s team found in modern American cities, while the population-area relationship ranged from 0.632 to 0.764 across the four periods studied [6]. Two settlement systems separated by roughly three thousand years, an ocean, and every intervening technology arrived at statistically similar exponents. In evolutionary terms this is closer to convergent evolution than to shared descent: the wing of a bird and the wing of a bat are not built from the same ancestral structure, but both solve the same aerodynamic problem under the same selective pressure, and end up with recognizably similar proportions. Ortman and colleagues’ result suggests that whatever forces produce superlinear scaling in cities — denser networks of exchange, shorter average distances between people who might collaborate — are not an artifact of industrial capitalism, electrification or any single technological lineage, but a structural regularity that reappears whenever human settlements pack people and infrastructure together at all, independent of the specific tools available to do it. That is a much stronger and more interesting claim than “American cities in 2000 obeyed a power law,” and it survives the Arcaute critique’s narrower point about how modern administrative boundaries are drawn, because the ancient Mesoamerican data was never bounded that way in the first place.
Infrastructure is inheritance, and Arthur’s lock-in explains why it is never fully repaid
Cut a street open anywhere with more than a century of continuous use and the trench wall reads like a stratigraphic column. Near the base sits the oldest surviving system, often a brick or stone sewer built to a standard nobody would use again but still doing useful work because replacing it wholesale would mean closing the street for months and re-excavating everything laid above it since. Above that, a cast-iron gas main from a later, differently regulated era. Above that, concrete conduit from a mid-twentieth-century electrification or telecoms build-out. On top, whatever fibre or data cable was cheapest to trench-and-lay most recently. None of these layers was ever fully excavated and replaced when the next one was added, because doing so was always more expensive than routing around it, and each generation’s engineers made the same calculation their predecessors made: build around what is already there rather than through it.
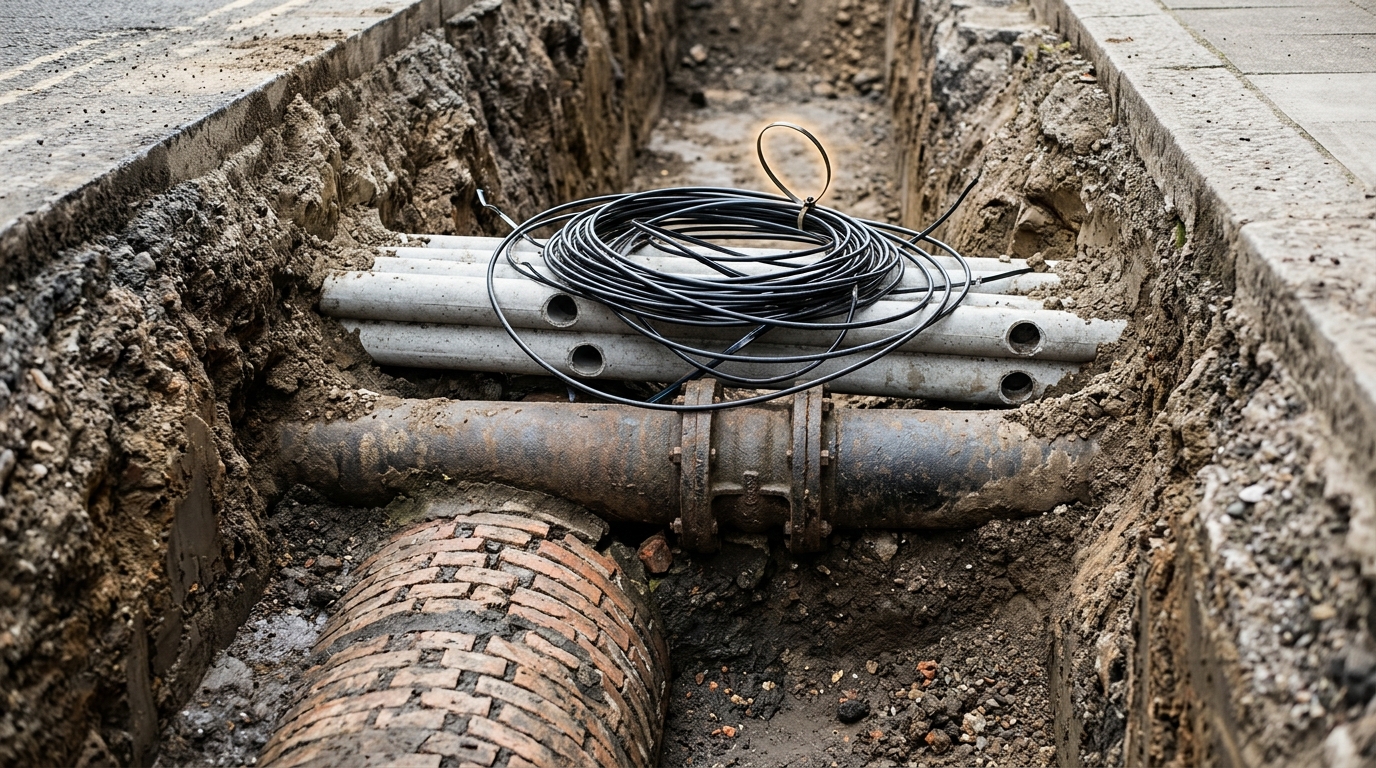
Figure 3. Nobody designed this section; it accumulated one budget cycle at a time, and the oldest layer, not the newest, is usually the one still doing the most load-bearing work. — Image prompt and art direction by Brecht Corbeel; generation pending.
W. Brian Arthur gave this pattern its formal name in 1989, in a paper on competing technologies that has become one of the most cited works in economics on path dependence [7]. Arthur’s argument, stripped to its mechanism, is that when adopting a technology generates increasing returns — network benefits that grow as more people adopt the same standard, learning effects that make the incumbent option cheaper to keep using than to learn a competitor’s, scale economies in producing complementary parts — small and often essentially accidental early events can tip a system toward one technology over an objectively equal or better rival, and then lock it there permanently, because the accumulated switching cost eventually exceeds any efficiency gain the alternative could offer. The paper’s own illustrative cases, the QWERTY keyboard layout and the historical dominance of light-water reactor designs in nuclear power, are chosen precisely because in each case a plausible alternative existed and lost not on merit but on the accident of who adopted what first. A city’s buried infrastructure is Arthur’s mechanism made physical rather than merely institutional: the switching cost of digging up and replacing an entire street’s worth of interdependent systems is so large, and grows with every layer added on top, that the earliest layer effectively becomes permanent whether or not it remains the best available technology.
The bill for carrying that inheritance forward is not abstract. The American Society of Civil Engineers’ 2025 report card gives the United States’ cumulative infrastructure an overall grade of C and estimates a $3.6 trillion investment gap over the coming decade [12] — a number specific to one of the wealthiest infrastructure bases on Earth, and a useful baseline for how much more strained the equivalent gap is likely to be in cities with a fraction of that fiscal capacity. Whether it is cheaper, in aggregate, to close that gap by retrofitting what already exists or by building fresh capacity on unencumbered ground is a question the published literature answers less cleanly than the debate around it would suggest; systematic, apples-to-apples cost comparisons between retrofit and greenfield urban infrastructure at scale are genuinely scarce, and this article will not manufacture a number that does not exist in a source it can verify. What the evidence does support, indirectly, is Bettencourt and colleagues’ own sublinear infrastructure exponent: adding a resident to an already-serviced parcel costs less, on the aggregate pattern their data shows, than extending a service network to reach an equivalent resident on new land [1]. Practice has not followed that logic. The UN’s 2025 urbanization report finds that the world’s built-up area grew almost twice as fast as its population between 1975 and 2025, pushing built-up land per person from 43 to 63 square metres, and that roughly sixty percent of the land converted to urban use since 1970 had previously been farmland [8] — global development has been extending outward onto cheap, legally unencumbered greenfield land far more than the efficiency argument for infill would predict, most plausibly because Arthur’s lock-in cuts in both directions: it protects a street’s buried infrastructure from being torn out and replaced, but that same tangle of existing rights-of-way, utility easements, and multiple private owners is exactly what makes retrofitting an already-built parcel slower and legally costlier than paving a new one on open ground.
Africa’s urban century is the demographic fact 2100’s built environment will be measured against
Population figures for 2100 do not arrive with the same institutional authority as figures for 2050; the United Nations’ own World Urbanization Prospects series, in both its 2018 and 2025 revisions, projects only to mid-century, and any number attached to a year beyond that belongs to whoever is doing the extrapolating, not to the UN itself. The 2025 revision’s key messages give the clearest available baseline. In 2025, forty-five percent of the world’s 8.2 billion people live in cities under the new Degree of Urbanization framework, more than double the twenty percent share in 1950, and two-thirds of the world’s population growth between now and 2050 is projected to occur inside cities, with most of the remainder in towns [8]. The number of megacities — ten million residents or more — quadrupled from eight in 1975 to thirty-three in 2025, nineteen of them in Asia, and is projected to reach thirty-seven by 2050; Jakarta currently ranks as the world’s most populous city at nearly forty-two million people, with fast-growing Dhaka expected to overtake it by mid-century while Tokyo’s shrinking population is projected to drop it to seventh rank [8]. Crucially, the same report finds that most of the world’s urban population lives in neither megacities nor even large cities: ninety-six percent of the roughly twelve thousand cities counted worldwide in 2025 have fewer than a million residents, and the fastest-growing among these smaller settlements are concentrated in sub-Saharan Africa and Central and Southern Asia [8]. More than half of the 986 million increase in the world’s city dwellers projected by 2050 is expected to concentrate in just seven countries — India, Nigeria, Pakistan, the Democratic Republic of the Congo, Egypt, Bangladesh and Ethiopia — which together are expected to add more than 500 million city residents [8]. Four of those seven are African. The earlier 2018 revision, working from a slightly different vintage of data, put the shape of the same trend even more bluntly: sixty-eight percent of the world’s population is projected to live in urban areas by 2050, up from fifty-five percent when that revision was published, with close to ninety percent of the roughly 2.5 billion additional urban dwellers concentrated in Asia and Africa, and India, China and Nigeria alone accounting for thirty-five percent of the projected increase [9].
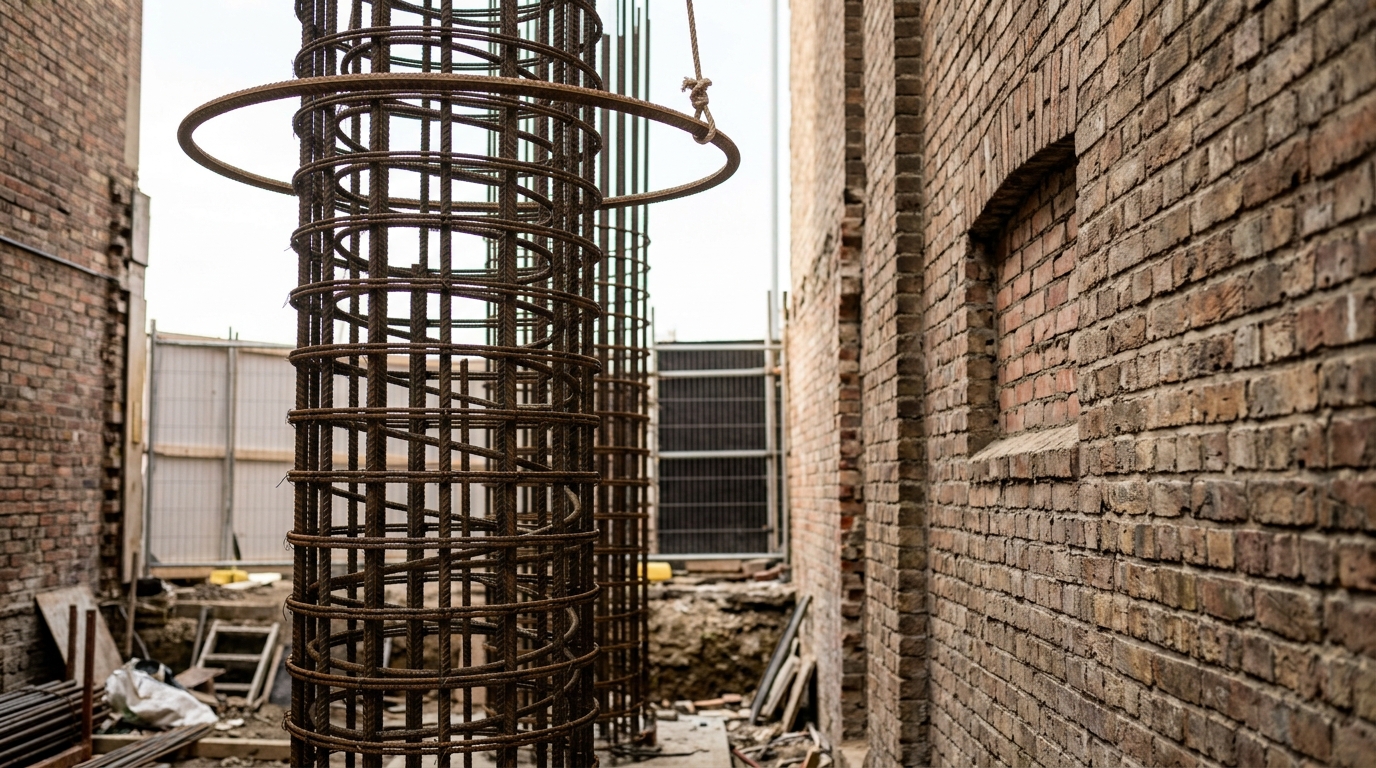
Figure 4. Most of the built floor space that will exist in 2100 has not been built yet, and most of it is being added exactly like this — squeezed tight against whatever the block already had standing. — Image prompt and art direction by Brecht Corbeel; generation pending.
Extending any of this to 2100 requires a named forecaster willing to extrapolate past the UN’s own horizon, and the most-cited attempt to do so is explicit about the risk it is taking. Hoornweg and Pope built a 2100 projection using three of the Shared Socioeconomic Pathways alongside a simple linear extrapolation of the World Urbanization Prospects trend, and stated plainly that their results are “projections” built on scenario assumptions, not forecasts with UN institutional backing [4]. Their WUP-extrapolation scenario puts Lagos as the world’s largest city in 2100 at 88.3 million people, followed by Kinshasa at 83.5 million, Dar es Salaam at 73.7 million, Mumbai at 67.2 million, Delhi at 57.3 million, Khartoum at 56.6 million, Niamey at 56.1 million, Dhaka at 54.2 million, Kolkata at 52.4 million, and Kabul at 50.3 million [4]. Five of those ten cities — Lagos, Kinshasa, Dar es Salaam, Khartoum and Niamey — barely register on any list of the world’s largest cities today. In the vocabulary this article has used throughout, that is closer to an adaptive radiation than to ordinary growth: an ecological analogy for a settlement pattern expanding at speed into a size class it had never previously occupied, the way island archipelagos see rapid diversification into niches left empty by an absence of prior competitors, rather than a lineage steadily climbing a ladder it was already on. The authors themselves flag the fragility of the exercise: their own paper states that the projections “are linked to the 2050 WUP city estimates,” which “suggests caution in their use,” particularly with respect to Africa’s projected growth rates [4]. Stated as a prediction with a horizon and a falsifier rather than a settled fact: Hoornweg and Pope’s scenario, checked against the UN’s own 2050 revision as it is periodically updated, would be substantially undermined if the named African cities’ recorded growth rates through 2050 fall well short of the trajectory their 2100 extrapolation assumes — a check any reader can make against future UN data long before 2100 arrives.
Climate acts as a selection pressure on urban form, and it sorts districts, not whole cities
None of the evidence above suggests climate hazards will kill cities outright; the near-immortality established earlier in this article gives no reason to expect Jakarta, Miami or Lagos to disappear from the map by 2100. What climate hazards demonstrably do is act as a selection pressure on urban form at a finer grain than the whole city — sorting which specific districts, specific elevations and specific construction types can keep functioning where they sit, and which cannot, while the city as an institution and an address persists somewhere nearby regardless.
Jakarta is the best-documented case of this pressure operating today, and its numbers come from three decades of independent geodetic monitoring rather than from advocacy. Abidin, Andreas, Gumilar and Brinkman, integrating leveling surveys, GPS surveys and InSAR satellite radar across the period 1974 to 2010, found that land subsidence across Jakarta — a coastal city of roughly ten million people occupying about 660 square kilometres of young, soft alluvial soil — proceeds at typical rates of three to ten centimetres per year, with total subsidence reaching up to about four metres in several locations over that thirty-seven-year span [10]. The dominant driver is excessive groundwater extraction, compounded by the sheer load of new construction on compressible soil and by natural consolidation of the alluvium itself; the resulting impacts documented in the field include cracked and tilting buildings, broken underground pipelines, malfunctioning drainage, expanding flood zones, and increased seawater intrusion inland [10]. This is engineering literature, not editorializing: the paper does not argue Jakarta should be abandoned, only that the physics of the ground it sits on are measurably working against the infrastructure built on top of it.

Figure 5. Climate adaptation mostly looks like this rather than like a seawall: a new part fitted quietly into an old opening so that water that used to flow one way stops flowing back the other. — Image prompt and art direction by Brecht Corbeel; generation pending.
Indonesia’s response has not been to retrofit the ground under Jakarta — that is not physically achievable at city scale — but to relocate one specific institutional function, national government, away from it entirely. The Nusantara Capital Authority’s own site frames the new capital in East Kalimantan around a “Vision 2045” and describes ambitions including seventy-five percent green open space and airport transit connections under fifty minutes by 2030 [13]; these are the government’s own stated targets, worth reading as commitments rather than as facts already achieved. Notably, the Authority’s own public-facing material emphasizes what Nusantara will become rather than explicitly citing Jakarta’s subsidence figures as the reason for leaving — the causal link between the documented physical hazard and the political decision to relocate is this article’s own analytical inference, drawn from independently published geodetic evidence, not a claim the source itself makes in those terms. Read in the evolutionary vocabulary this piece has used throughout, Nusantara is not the death of Jakarta — every demographic source cited above expects Jakarta’s urban population to keep growing regardless — but something closer to one specific lineage, the seat of national government, vacating a niche whose physical substrate is failing, while a related population continues occupying the wider site nearby. It is managed retreat performed at the scale of an entire national capital rather than a single flood-prone neighbourhood, and very likely the largest deliberate instance of that pattern underway anywhere today.
The broader engineering and policy literature treats retreat as one tool among several rather than as a last resort. Siders, Hino and Mach argue explicitly against the older framing of retreat as necessarily “a last resort, a failure to adapt, or a one-time emergency action,” proposing instead that it be understood as “a suite of adaptation options that are both strategic and managed,” chosen deliberately alongside its alternatives rather than forced only once every other option has failed [11]. Their paper also names the honest cost of the alternative directly: retreat “has been ad hoc” in practice so far, “frequently inequitable,” and prone to ignoring both the communities left behind in an evacuated district and the communities receiving people who move [11]. Retreat’s competing strategy — engineering a district to keep occupying threatened ground, through seawalls, levees, pumped drainage or elevated construction — is what this article calls costly persistence: a district can, in principle, be defended indefinitely, but the defence has to be paid for in perpetuity, on ground whose underlying hazard (subsidence, sea-level rise, heat) does not stop once the first wall is built. Selection, in the evolutionary sense used throughout this piece, is exactly the choice being made district by district between these two strategies: not whether the city survives, which by the evidence in this article’s opening section it very likely will, but which of its specific parts do.
By 2100 the built environment splits between two named, falsifiable strategies
Two scenarios follow from the evidence assembled above, each naming its own horizon, assumptions, observable indicators and disconfirmation condition, in the discipline this publication applies to every claim about the future. They are not mutually exclusive across the globe; a plausible 2100 has elements of both operating in different regions at once, exactly the way commodity and premium pricing regimes can coexist within a single industry.
Scenario one: Retrofitted Megaregion Consolidation. The claim: by 2100, a majority of the built floor area occupied within today’s existing metropolitan footprints has been added through infill, vertical densification and infrastructure retrofit rather than through new peripheral construction, reversing the greenfield-dominant pattern of the past half-century. Horizon: 2060, as an interim check, with a full assessment at 2100. Assumptions: construction techniques for retrofitting occupied buildings and utility corridors continue to industrialize and fall in relative cost, the way the modular assembly shown throughout this article’s figures suggests is already underway at the scale of individual buildings; and land-use policy in the fastest-growing regions begins reversing, rather than continuing, the pattern in which sixty percent of newly urbanized land since 1970 was previously farmland [8]. Indicators: the ratio of built-up land to population reported in future UN urbanization revisions flattening or reversing relative to the 43-to-63-square-metre-per-person trend recorded for 1975 to 2025 [8]; the roughly three thousand already-shrinking cities identified in the 2025 revision [8] stabilizing or reversing into renewed growth through infill rather than continuing to hollow out; and a rising, publicly reported share of new floor area in national construction statistics classified as retrofit or infill rather than new peripheral build. Disconfirmation: if built-up land per capita continues climbing at or above its 1975-2025 rate through mid-century, and if the fastest-growing cities named in Hoornweg and Pope’s 2100 extrapolation — Lagos, Kinshasa, Dar es Salaam, Khartoum, Niamey chief among them [4] — continue adding population predominantly through new peripheral construction rather than densification of existing built-up area, this scenario is disconfirmed.
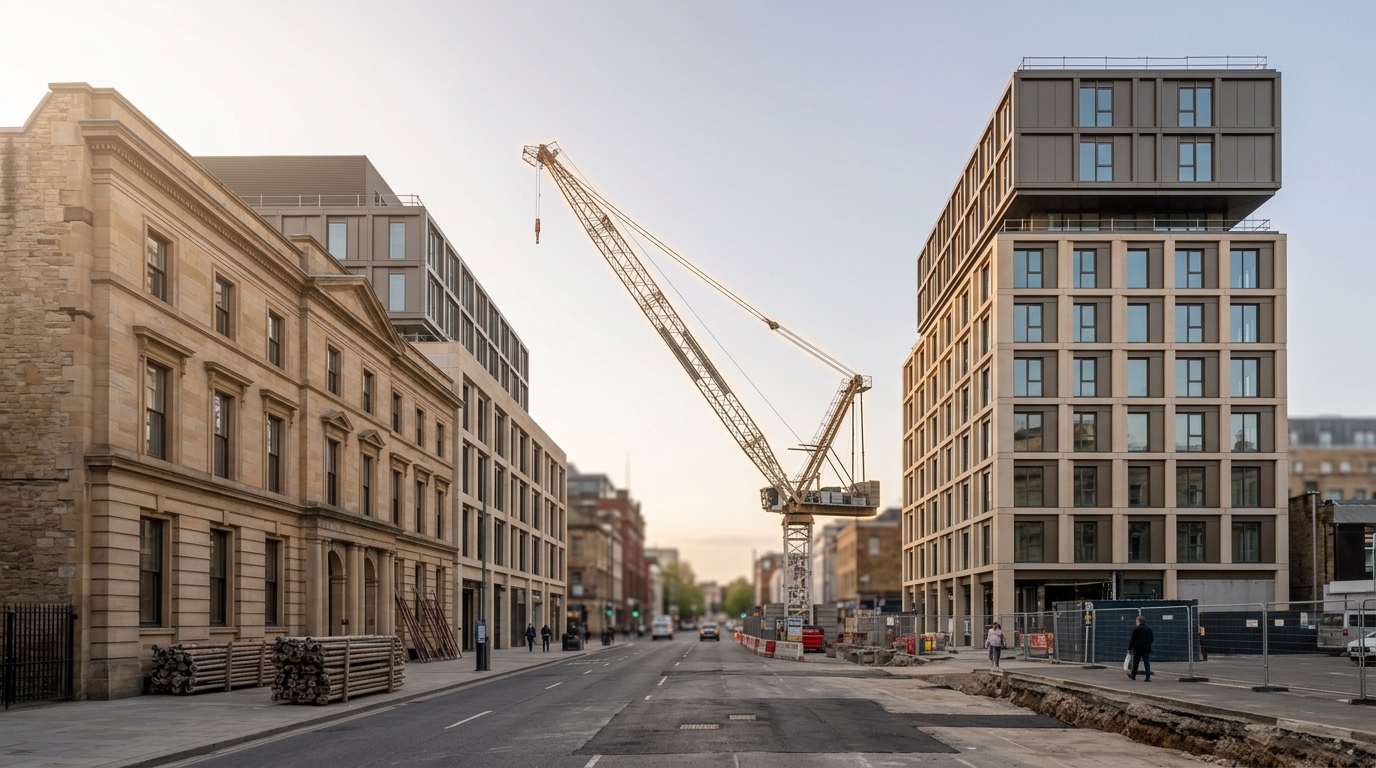
Figure 6. By 2100 the world will not have picked one of these two strategies; every surviving city will be some mixture of the retained shell on the left and the new tower on the right, in a ratio nobody has chosen on purpose yet. — Image prompt and art direction by Brecht Corbeel; generation pending.
Scenario two: Distributed New-Build Radiation. The claim: by 2100, most of the net new built floor area added since today sits on land that was not urban at the start of the period, concentrated in the specific fast-growing cities named above, because greenfield land remains cheaper and faster to build on than retrofitting an already-dense, institutionally encumbered core, and because the fiscal capacity to fund large-scale retrofit — already strained enough in the United States to leave a $3.6 trillion decade-long gap by the American Society of Civil Engineers’ own accounting [12] — is even further out of reach for the lower-income, faster-growing cities the United Nations’ own country-level breakdown identifies: India, Nigeria, Pakistan, the Democratic Republic of the Congo, Egypt, Bangladesh and Ethiopia [8]. Horizon: 2100, with an interim check at 2060. Assumptions: informal and semi-formal peripheral construction remains cheaper and faster to deliver than formal retrofit of existing dense cores in these specific countries; and national fiscal capacity in that group of seven does not converge meaningfully with the levels available to wealthier, slower-growing cities within the period. Indicators: continued or rising urban population growth in small and medium-sized cities specifically — which the 2025 revision already identifies as home to most of the world’s urban population and among the fastest-growing settlement types, particularly in sub-Saharan Africa and Central and Southern Asia [8] — outpacing growth in already-large, already-dense cores; and continued farmland-to-urban land conversion at or above the sixty-percent-since-1970 rate already recorded [8]. Disconfirmation: if formal or informal in-place upgrading of existing settlements becomes the dominant mode of population absorption in the seven named countries, overtaking new peripheral construction as measured by national or UN-tracked land-use statistics, this scenario is disconfirmed.
Reading the two scenarios side by side, the honest 2100 is very likely neither one cleanly, but some cities behaving like the first and others like the second, sorted by exactly the fiscal and institutional variables named in each scenario’s assumptions rather than by any single global trend. What both scenarios share, and what the smart-city vendor material the publisher’s brief for this piece warned against consistently omits, is that neither strategy is chosen by a rendering or a pitch deck. Both are the aggregate outcome of millions of individual decisions about whether it is cheaper this year to retrofit a specific parcel or to build fresh on a specific field, made under the specific fiscal, legal and geological constraints of a specific place — the same kind of decision visible, in miniature, on the single construction block this article has used as its recurring image throughout.
The longest-lived replicator human beings have ever built
Put the pieces back together. A public company’s odds of disappearing in any given year are roughly constant regardless of its age, producing a population-wide half-life of about a decade [3]. A city, by contrast, recovered its exact prewar relative size within a few decades of being reduced to rubble by incendiary and atomic bombing [5], and the mechanism behind that durability is not sentiment but Arthur’s increasing-returns lock-in made physical: a street’s buried infrastructure becomes progressively more expensive to replace with every layer added on top of it, until building around the old layer is cheaper than removing it forever [7]. The scaling advantages that make a city worth staying in — Bettencourt and colleagues’ superlinear returns to size [1], replicated in a Mesoamerican settlement system three thousand years removed from any shared technology with the cities that inspired the original study [6] — give every generation a reason to keep building on top of what the last generation left, rather than starting elsewhere. None of this is a property of any single company, government, or dynasty that has ever occupied a city; each of those is exactly the kind of short-lived tenant the opening section of this article described. It is a property of the site itself, and of the accumulating physical commitment made to it.
By 2100, on the evidence assembled here, most of the specific institutions currently governing, financing and building the world’s cities — the firms with their roughly ten-year half-life, quite possibly several of the governments now drafting capital-relocation plans, certainly most named technology vendors currently selling “smart city” platforms — will be gone, replaced by successors doing the same job under different names. The streets, the buried pipe, and the demographic weight now shifting decisively toward the cities named throughout this article’s fourth section will, in overwhelming likelihood, still be there, still being built on top of, still deciding — the way a trench cut open anywhere with enough history in it already shows — what the next layer gets to look like. The city outlives everything that builds it. That is not a metaphor about resilience. It is the specific, falsifiable, and so far entirely unbroken pattern this article has tried to document.
Sources
- Luís M. A. Bettencourt, José Lobo, Dirk Helbing, Christian Kühnert, and Geoffrey B. West. Growth, Innovation, Scaling, and the Pace of Life in Cities. Proceedings of the National Academy of Sciences (2007). DOI: 10.1073/pnas.0610172104.
- Elsa Arcaute, Erez Hatna, Peter Ferguson, Hyejin Youn, Anders Johansson, and Michael Batty. Constructing Cities, Deconstructing Scaling Laws. Journal of the Royal Society Interface (2015). DOI: 10.1098/rsif.2014.0745.
- Madeleine I. G. Daepp, Marcus J. Hamilton, Geoffrey B. West, and Luís M. A. Bettencourt. The Mortality of Companies. Journal of the Royal Society Interface (2015). DOI: 10.1098/rsif.2015.0120.
- Daniel Hoornweg and Kevin Pope. Population Predictions for the World's Largest Cities in the 21st Century. Environment and Urbanization (2017). DOI: 10.1177/0956247816663557.
- Donald R. Davis and David E. Weinstein. Bones, Bombs, and Break Points: The Geography of Economic Activity. American Economic Review (2002). DOI: 10.1257/000282802762024502.
- Scott G. Ortman, Andrew H. F. Cabaniss, Jennie O. Sturm, and Luís M. A. Bettencourt. Settlement Scaling and Increasing Returns in an Ancient Society. Science Advances (2015). DOI: 10.1126/sciadv.1400066.
- W. Brian Arthur. Competing Technologies, Increasing Returns, and Lock-In by Historical Events. The Economic Journal (1989). DOI: 10.2307/2234208.
- United Nations Department of Economic and Social Affairs, Population Division. World Urbanization Prospects 2025: Key Messages. United Nations Department of Economic and Social Affairs (2025).
- United Nations Department of Economic and Social Affairs, Population Division. 68% of the World Population Projected to Live in Urban Areas by 2050, Says UN. United Nations Department of Economic and Social Affairs (2018).
- H. Z. Abidin, H. Andreas, I. Gumilar, and J. J. Brinkman. Study on the Risk and Impacts of Land Subsidence in Jakarta. Proceedings of the International Association of Hydrological Sciences (2015). DOI: 10.5194/piahs-372-115-2015.
- A. R. Siders, Miyuki Hino, and Katharine J. Mach. The Case for Strategic and Managed Climate Retreat. Science (2019). DOI: 10.1126/science.aax8346.
- American Society of Civil Engineers. 2025 Report Card for America's Infrastructure. American Society of Civil Engineers (2025).
- Otorita Ibu Kota Nusantara (Nusantara Capital Authority). Ibu Kota Nusantara: Official Portal of Indonesia's New Capital. Government of Indonesia (2026).
Originally published at https://absolutedigitalpublishers.com/articles/cities-are-organisms-that-refuse-to-die-urban-evolution-to-2100.